


FXOpen

According to the chart for General Motors (GM), the following points stand out:
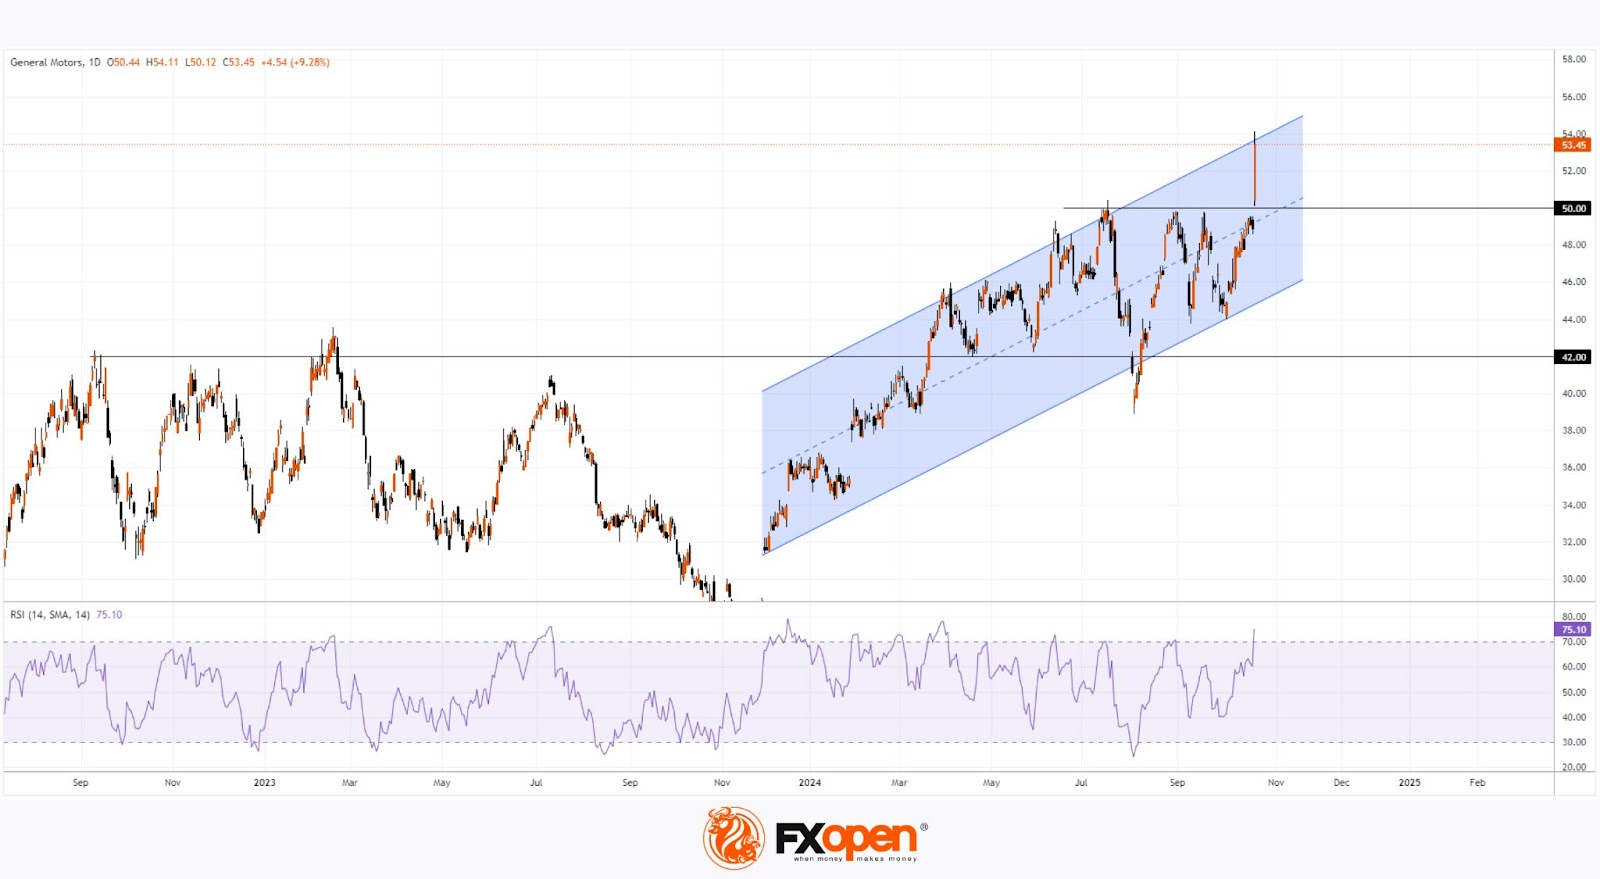
→ Yesterday, the share price closed above $53, a significant rise from just below $49 the previous day.
→ Since the beginning of the year, the stock has experienced an increase of around 50%.
The sharp rise in price can be attributed to the company's robust Q3 earnings report:
→ General Motors reported a 10% year-on-year increase in gross revenue for Q3, reaching $48.75 billion, significantly higher than analysts' expectations of $44.67 billion.
→ Earnings per share climbed by 30% year-on-year to $2.96, compared to a forecast of $2.49.
→ Additionally, the company raised its earnings guidance for the next quarter and indicated that it is intensifying efforts to launch autonomous vehicles.
Technical analysis of General Motors' stock reveals that:
→ In 2024, the stock has formed an upward channel (highlighted in blue), and the current price has reached its upper boundary.
→ The psychological barrier at $50 per share, which has acted as resistance since July, has now been breached. Notably, the $42 level served as resistance for several months before changing its role; $50 may follow this pattern in the future.
→ The RSI indicator has entered overbought territory.
Will the stock's upward trajectory continue? It is plausible that as investor enthusiasm from the strong earnings report subsides, GM's share price could experience a correction. This seems likely, given its proximity to the upper channel boundary and the overbought status indicated by the RSI. In such a scenario, the price could drop back towards the median line of the blue channel.
According to TipRanks, 11 out of 20 analysts recommend buying GM shares, with an average target price of $55 within the next 12 months. Given the strong fundamental data from General Motors, analysts' forecasts for GM stock may be adjusted upwards.
Buy and sell stocks of the world's biggest publicly-listed companies with CFDs on FXOpen’s trading platform. Open your FXOpen account now or learn more about trading share CFDs with FXOpen.
This article represents the opinion of the Companies operating under the FXOpen brand only. It is not to be construed as an offer, solicitation, or recommendation with respect to products and services provided by the Companies operating under the FXOpen brand, nor is it to be considered financial advice.
Stay ahead of the market!
Subscribe now to our mailing list and receive the latest market news and insights delivered directly to your inbox.


Latest articles

Market Analysis: GBP/USD Dips Further As EUR/GBP Regains Traction
GBP/USD failed to climb above 1.3500 and corrected some gains. EUR/GBP started a decent increase and might aim for more gains above 0.8700.
Important Takeaways for GBP/USD and EUR/GBP Analysis Today
· The British Pound


Market Insights with Gary Thomson: Oil, US Retail Sales & NFP in Focus
In this video, we’ll explore the key economic events and market trends, shaping the financial landscape. Get ready for insights into financial markets to help you navigate the week ahead. Let’s dive in!
In this episode of Market