


FXOpen

The reason is clear: confirmed US and Israeli strikes on targets in Iran, including reports of the death of Supreme Leader Ali Khamenei, have triggered renewed demand for safe-haven assets, pushing gold prices higher.
As of Monday morning, news of further escalation continues to emerge, while the price per ounce has climbed above the $5,400 level — for the first time since late January. Analysts (including J.P. Morgan and Bank of America) are already revising their targets. In their view, if the price consolidates above $5,400, this could point to a move towards $6,000 by the end of 2026.
Technical Analysis of the XAU/USD Chart
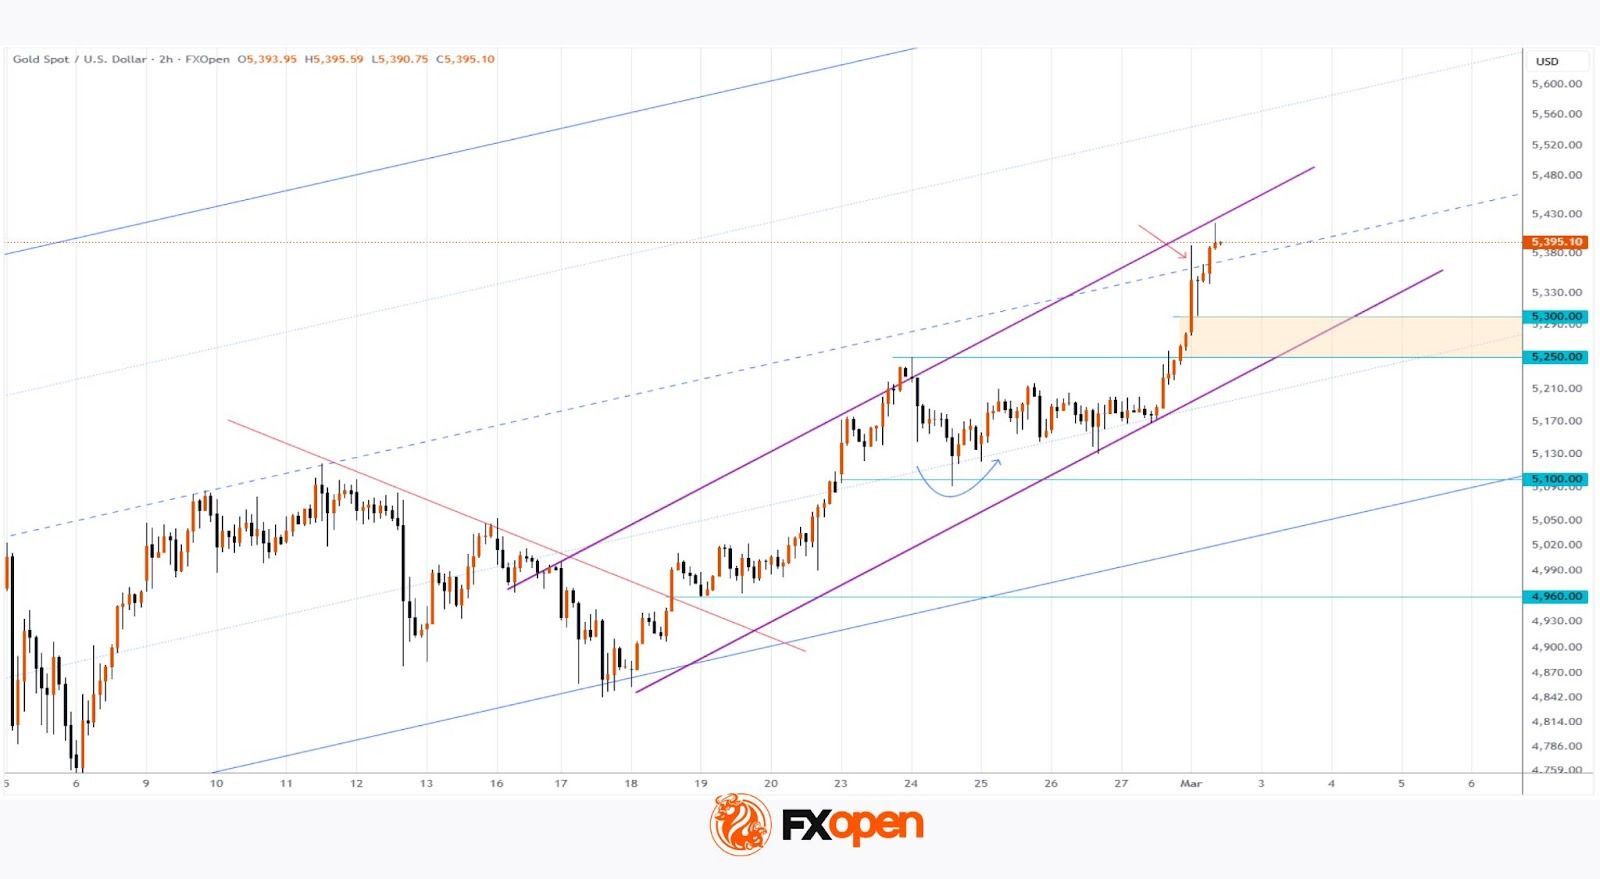
On 23 February, when analysing gold price movements, we confirmed that the long-term ascending channel remained in force and suggested that:
→ bulls would attempt to reach the median of the channel;
→ if gold were to pull back, the $5,100 level would act as support.
Indeed, both assumptions materialised. As indicated by the arrows:
→ on 24 February, the price rebounded from the stated support level;
→ this morning, the price reached the median. At the first test, bears showed aggression, but extraordinary geopolitical risks pushed the quotation into the upper half of the channel.
It is worth noting that the price has left behind:
→ the psychological $5,300 mark;
→ the $5,250 level, which acted as resistance in February (and may now be expected to provide support).
At the same time, nearby resistance is formed by a local ascending channel (shown in purple), constructed using February’s price extremes on the XAU/USD chart.
It cannot be ruled out that, following the shocking news over the weekend, market emotions may subside, leading to a pullback in gold prices. In that case, support may emerge in the $5,250–5,300 area, where the lower boundary of the purple uptrend line is located.
Start trading commodity CFDs with tight spreads (additional fees may apply). Open your trading account now or learn more about trading commodity CFDs with FXOpen.
This article represents the opinion of the Companies operating under the FXOpen brand only. It is not to be construed as an offer, solicitation, or recommendation with respect to products and services provided by the Companies operating under the FXOpen brand, nor is it to be considered financial advice.
Stay ahead of the market!
Subscribe now to our mailing list and receive the latest market news and insights delivered directly to your inbox.


Latest articles
Weekend Trading: Market Access, Liquidity, and Trading Conditions
Weekend trading refers to market activity outside

AUD/USD Falls Below Key Support
As the AUD/USD chart indicates, the Australian dollar is showing weakness against the US dollar at the start of the week. Notably, we are seeing a bearish breakout below the lower boundary of an important ascending channel that had

Gold Price Falls to 2026 Low
As the XAU/USD chart indicates, today, shortly after the start of the trading week, gold fell below $4,150 (the low of the year). The last time prices were at this level was in early December 2025, before the