


FXOpen

As shown by the XAU/USD chart:
→ Gold has reached a new all-time high;
→ This morning, gold is trading around $2,567 per ounce.
Bullish sentiment is being driven by expectations of a Federal Reserve rate cut next week. According to MoneyControl, the International Monetary Fund stated on Thursday that it would be "appropriate" for the Fed to start its long-awaited monetary easing cycle at its meeting next week, as inflation risks have eased.
On 6 September, we analysed the gold price chart and identified:
→ an ascending channel (shown in blue);
→ two resistance lines forming a “bullish flag” pattern.
Gold’s surge to a new all-time high has broken through the “bullish flag,” suggesting a potential resumption of the rally. How successful could this be?
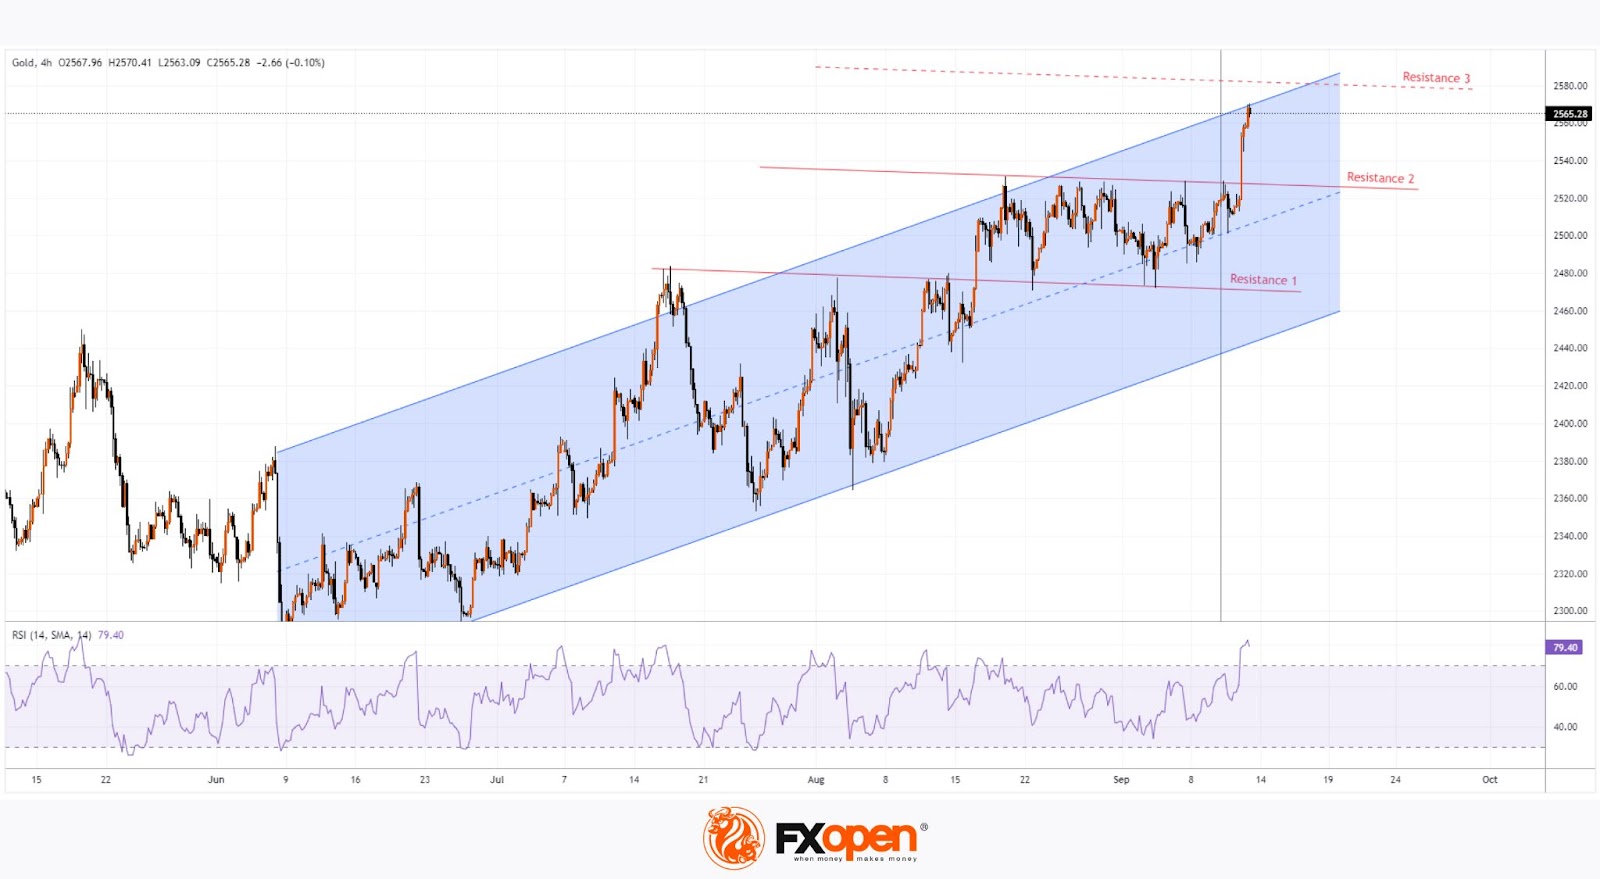
Technical analysis of the XAU/USD chart today shows that the price is approaching resistance levels formed by:
→ the upper boundary of the blue channel;
→ Resistance line 3, which can be viewed as the target following the breakout of resistances 1 and 2, according to technical analysis principles.
Therefore, gold has limited potential for further growth due to the proximity of these resistance levels. It's worth noting that the RSI is in the overbought zone, which could encourage bulls to take profits at this historic peak.
Given these factors, the market may be vulnerable to a correction. However, the key influence will be the actual decision from the Fed, which will be announced next Wednesday.
Start trading commodity CFDs with tight spreads (additional fees may apply). Open your trading account now or learn more about trading commodity CFDs with FXOpen.
This article represents the opinion of the Companies operating under the FXOpen brand only. It is not to be construed as an offer, solicitation, or recommendation with respect to products and services provided by the Companies operating under the FXOpen brand, nor is it to be considered financial advice.
Stay ahead of the market!
Subscribe now to our mailing list and receive the latest market news and insights delivered directly to your inbox.


Latest articles

Market Analysis: GBP/USD Dips Further As EUR/GBP Regains Traction
GBP/USD failed to climb above 1.3500 and corrected some gains. EUR/GBP started a decent increase and might aim for more gains above 0.8700.
Important Takeaways for GBP/USD and EUR/GBP Analysis Today
· The British Pound


Market Insights with Gary Thomson: Oil, US Retail Sales & NFP in Focus
In this video, we’ll explore the key economic events and market trends, shaping the financial landscape. Get ready for insights into financial markets to help you navigate the week ahead. Let’s dive in!
In this episode of Market