


Gold Price Reaches a New All-Time High
FXOpen

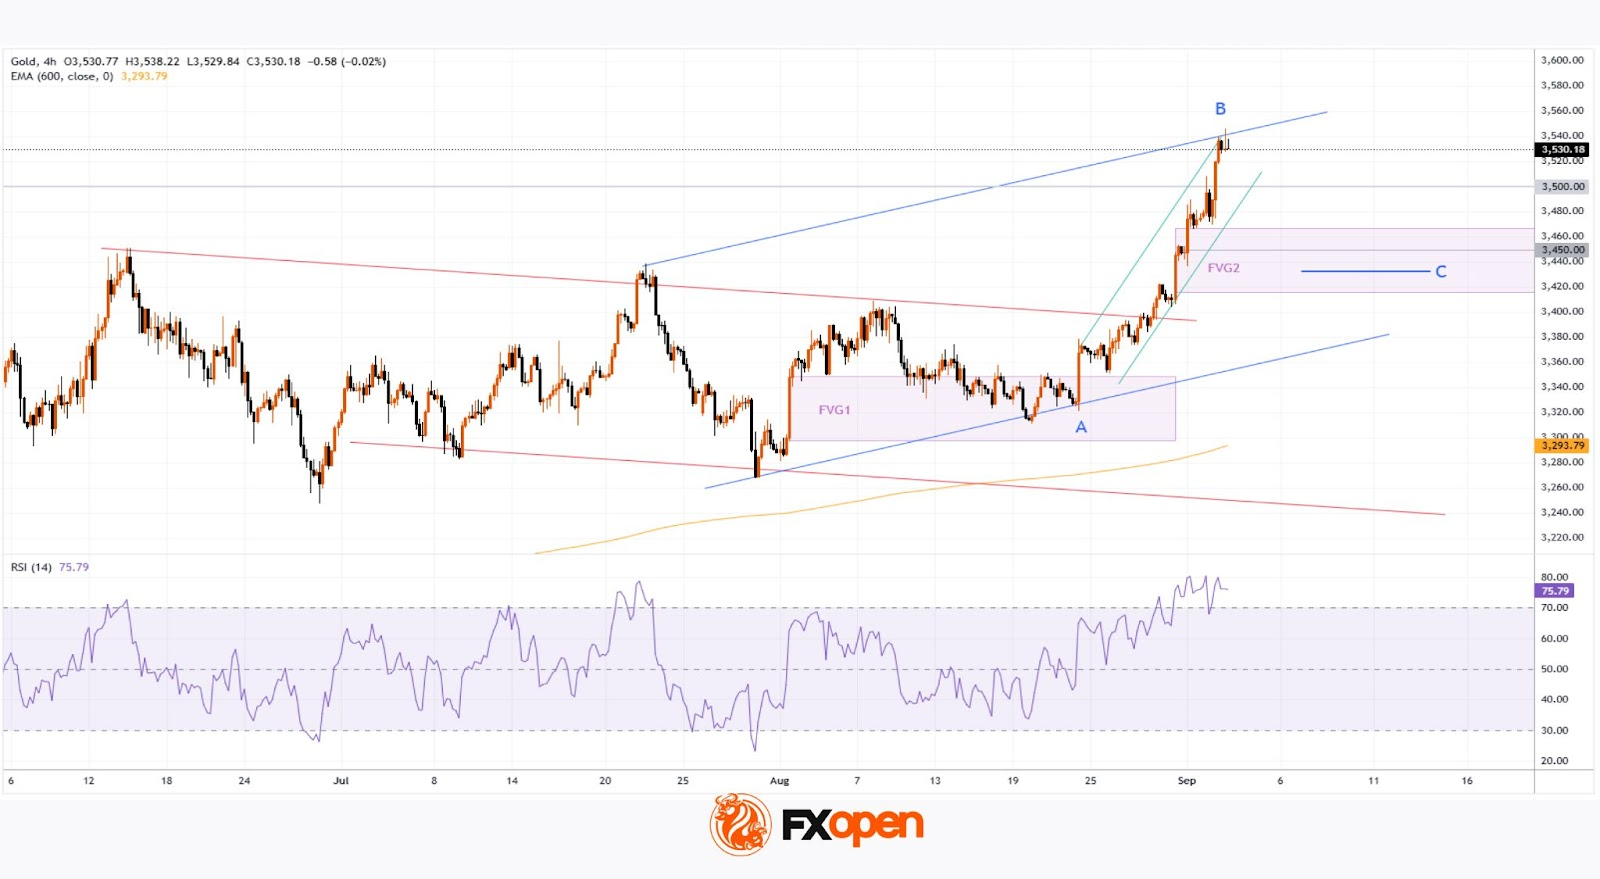
As shown on today’s XAU/USD chart, the price of gold has risen above $3,530 per ounce for the first time in history.
In 2025, the increase in gold prices has been driven by sustained central bank purchases, asset diversification, steady demand for so-called safe-haven assets amid geopolitical and trade tensions, as well as general dollar weakness.
At the beginning of September, bullish sentiment may have been reinforced by:
→ Expectations of a Federal Reserve rate cut. According to the CME FedWatch tool, markets are pricing in a nearly 92% probability of a 25-basis-point rate cut at the Fed meeting on 17 September. Gold, as a non-yielding asset, is typically seen as a beneficiary of low interest rates.
→ News from China, where, in the presence of leaders from many countries, the establishment of a SCO development bank was announced. Market participants may have interpreted this as a new source of geopolitical risk and as pressure on the dollar’s status. Donald Trump has already claimed that the summit in China represents a conspiracy against the United States.
Technical Analysis of the XAU/USD Chart
Looking at gold’s price on 11 August, we:
→ Drew descending lines forming a red channel.
→ Highlighted an important support zone in the form of a bullish Fair Value Gap (marked as FVG1 in purple).
New data allows for the following observations:
→ FVG1 acted as support in the second half of August.
→ The red channel lines resemble a large-scale bullish flag pattern within a long-term uptrend, underscored by the EMA.
By using the July and August extremes, we can trace the outlines of an upward trajectory (shown in blue). The price is currently near the upper boundary, which could trigger a pullback, given overbought signals on the RSI indicator and investors’ potential desire to take profits after more than a 6% rise over the past 10 days.
From a bullish perspective, a possible pullback target could be the potential support area formed by:
→ FVG2. Although it does not strictly conform to construction rules, it reflects an imbalance in favour of buyers that led to a sharp price rally. Bears attempted to resist around the psychological $3,500 level but were defeated.
→ Level C, representing the 50% Fibonacci retracement of the A→B impulse.
It should be noted that the upward impulse has not yet been exhausted, as indicated by the green lines.
Start trading commodity CFDs with tight spreads (additional fees may apply). Open your trading account now or learn more about trading commodity CFDs with FXOpen.
This article represents the opinion of the Companies operating under the FXOpen brand only. It is not to be construed as an offer, solicitation, or recommendation with respect to products and services provided by the Companies operating under the FXOpen brand, nor is it to be considered financial advice.
Stay ahead of the market!
Subscribe now to our mailing list and receive the latest market news and insights delivered directly to your inbox.


Latest articles


Market Repricing of Risk as Gold Loses Safe-Haven Demand
Geopolitical tensions in the Middle East had remained the primary macro driver for the gold market over recent weeks; however, on 8 April the situation shifted sharply as the United States and Iran agreed to a temporary two-week ceasefire, including

Commodity Currencies on the Rise: Market Focus Shifts to US and Canadian Data
Commodity-linked currencies continue to strengthen, while the US dollar remains under pressure amid easing geopolitical tensions and a shift in investor preference towards riskier assets. Reports of a temporary ceasefire between the US and Iran have helped stabilise sentiment and