


Gold Price Surges Above $4,000
FXOpen

As the chart shows, XAU/USD climbed above the $4,000 mark today, a move likely driven by:
→ Weakness in the US dollar index – or a pullback from the resistance level discussed in yesterday’s DXY analysis.
→ Concerns over the ongoing US government shutdown – according to media reports, one consequence has been that American airlines began limiting ticket sales in November.
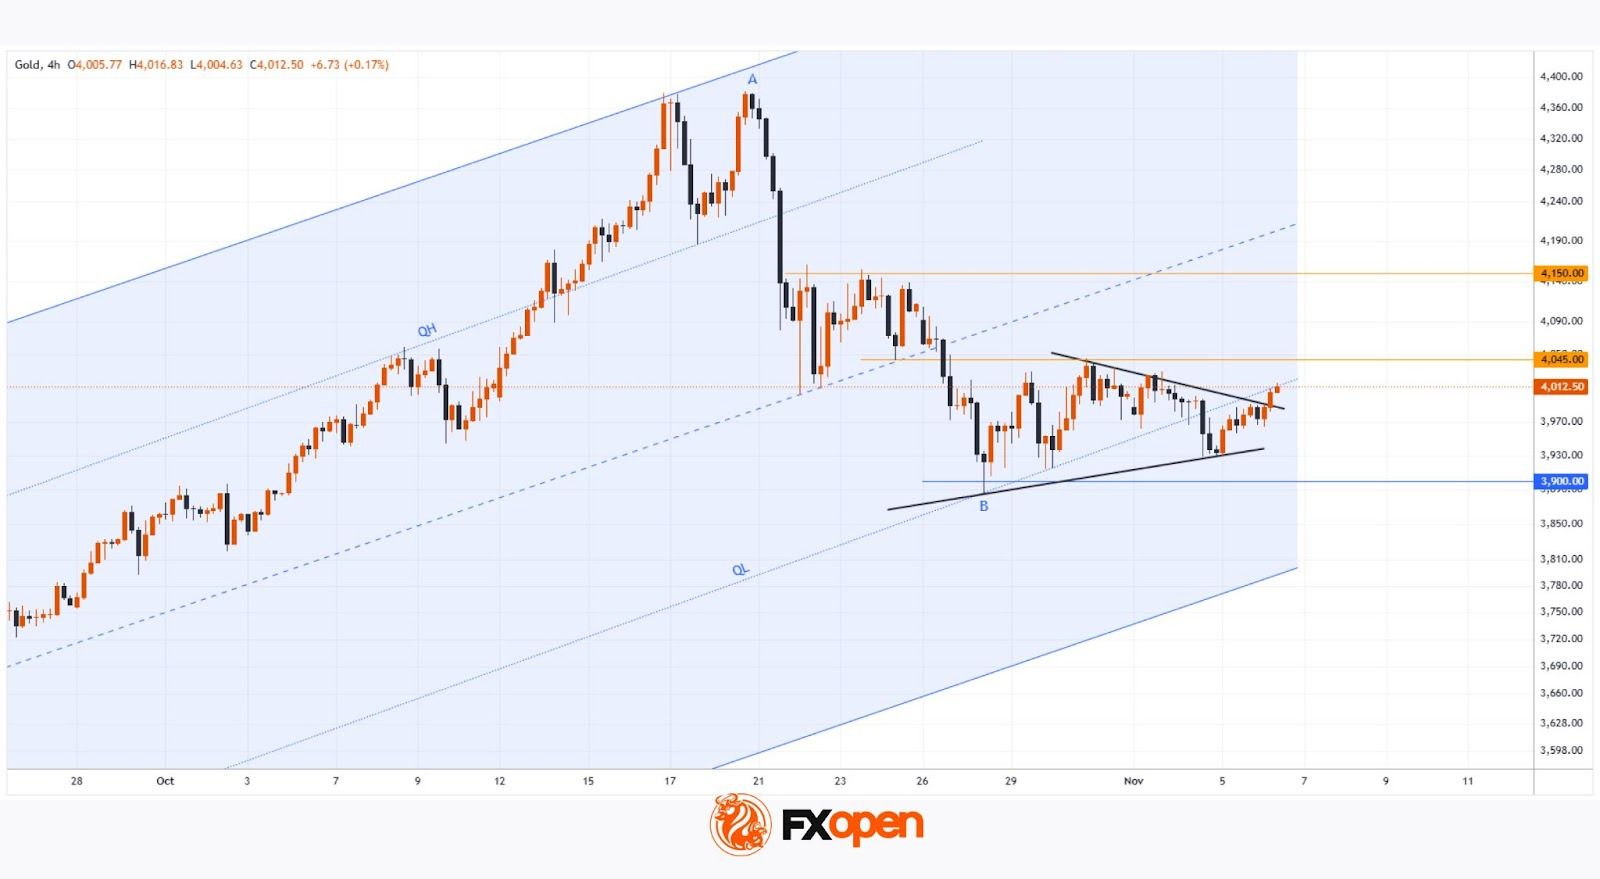
Technical Analysis of XAU/USD
On 28 October, our analysis of gold price movements showed the following:
→ We constructed an ascending channel (marked in blue), illustrating the metal’s remarkable rally from its August low.
→ We suggested that the developing pullback might target the QL line, reinforced by the round-number support at $3,900.
This support zone successfully held, forming a local bottom at point B, after which the price entered a period of consolidation, resembling a symmetrical triangle pattern.
Notably, gold has today broken upward through this triangle (outlined in black). In the broader context, this breakout represents a strong signal from the bulls, suggesting a possible resumption of the 2025 uptrend.
If buying momentum continues, their strength may be tested by:
→ Resistance at $4,045;
→ Resistance near $4,150, which aligns with the 50% retracement of the A→B decline and has previously acted as a reversal zone for XAU/USD.
Start trading commodity CFDs with tight spreads (additional fees may apply). Open your trading account now or learn more about trading commodity CFDs with FXOpen.
This article represents the opinion of the Companies operating under the FXOpen brand only. It is not to be construed as an offer, solicitation, or recommendation with respect to products and services provided by the Companies operating under the FXOpen brand, nor is it to be considered financial advice.
Stay ahead of the market!
Subscribe now to our mailing list and receive the latest market news and insights delivered directly to your inbox.


Latest articles

Amazon Earnings: Does the Chart Already Know Something the Numbers Don't?
All eyes are on July 30, when Amazon reports Q2 2026 earnings, with Wall Street increasingly convinced the bar has been set too low. Consensus sees EPS near $1.82-$2.26 on roughly $197 billion in revenue, but the

WTI Analysis: Gap Breaks Short-Term Trend as Price Remains Trapped Between the POC and Profile Boundary
WTI crude oil plunged by more than 7% on 27 July 2026 after the US suspended a series of strikes against Iran over the weekend, raising hopes of a diplomatic solution and the reopening of shipping through the Strait of

US Dollar Index: A Defining Week for the King of the Markets
The dollar heads into a pivotal week trading near 101.80, just off a 15-month high, with the Fed's July 29 meeting standing as the clear focal point. Markets currently price roughly a 65% chance of a hold, though renewed