


FXOpen

We noted bullish sentiment in the gold market six days ago:
→ The price is moving within an ascending channel (shown in blue);
→ Bulls may attempt to set a historic record amid the release of economic news.
As today's XAU/USD chart shows, the gold price has risen above the psychological level of $2500. This was influenced by last week's news, indicating that market participants expect the Federal Reserve to cut rates as early as September. Notably, important signals regarding U.S. monetary policy may be given later this week at the annual economic symposium in Jackson Hole, attended by finance ministers and central bank governors.
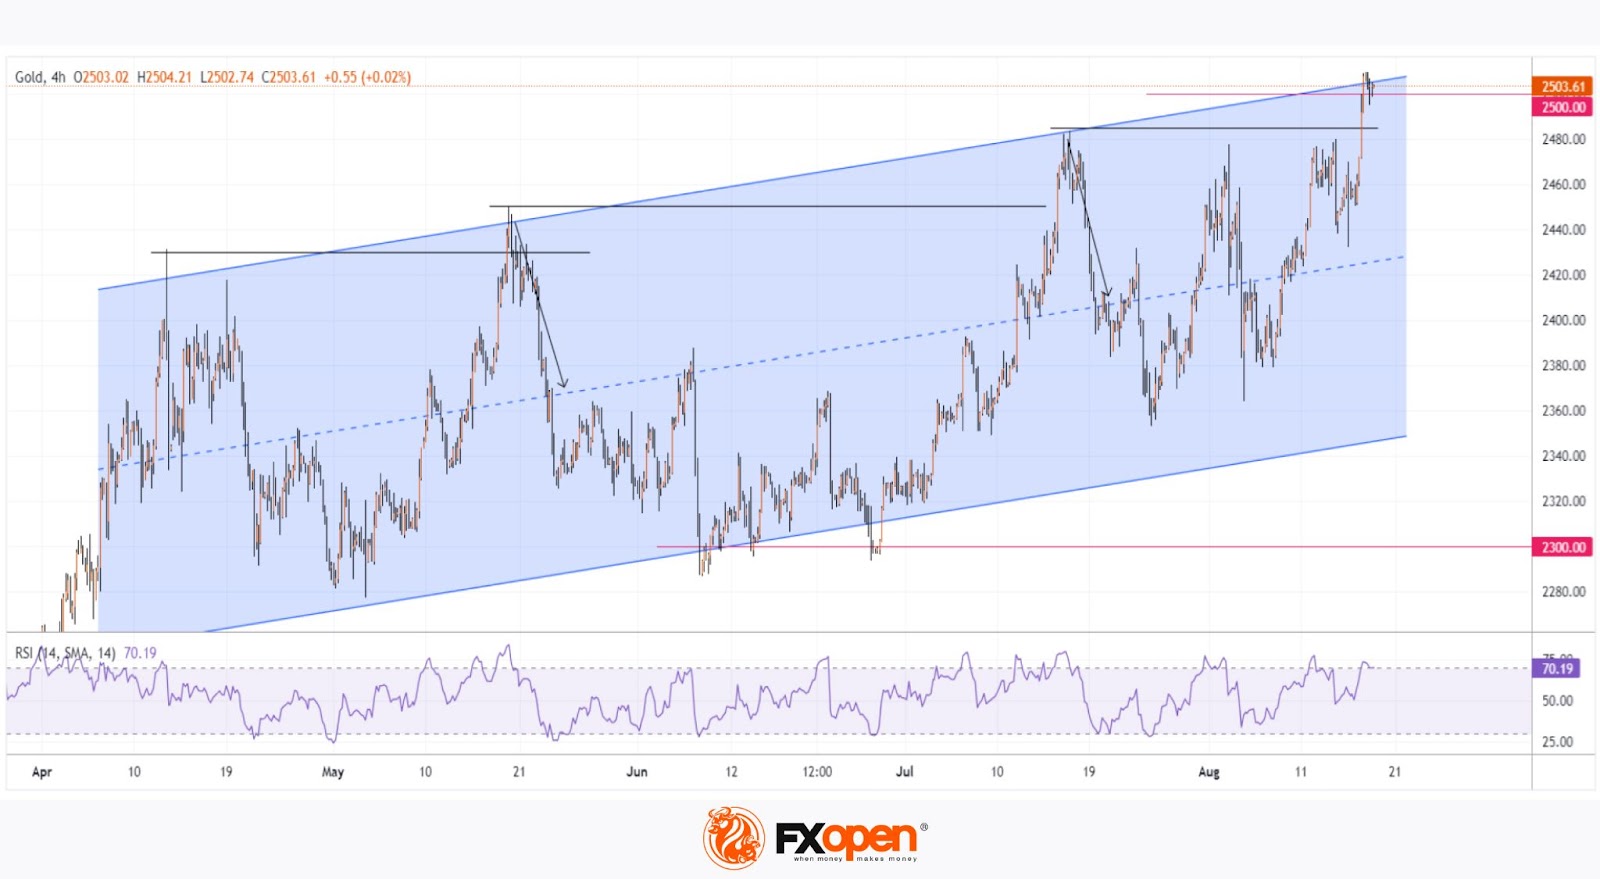
Technical analysis of the XAU/USD chart shows that gold continues to move within the ascending channel.
It's worth noting two historical records set this year – in May and July. In both cases:
→ The price encountered resistance at the upper boundary of the channel;
→ The RSI indicator entered the overbought zone;
→ The rise above the previous peak was minimal;
→ A subsequent decline to the median line of the blue channel followed (as shown by the arrows).
It’s possible that a similar pattern could repeat for a third time, considering that the $2500 psychological level might act in favour of the bears – similar false breakouts (but in reverse) were observed at the $2300 level in June.
Read analytical Gold price forecasts for 2024 and beyond.
Start trading commodity CFDs with tight spreads (additional fees may apply). Open your trading account now or learn more about trading commodity CFDs with FXOpen.
This article represents the opinion of the Companies operating under the FXOpen brand only. It is not to be construed as an offer, solicitation, or recommendation with respect to products and services provided by the Companies operating under the FXOpen brand, nor is it to be considered financial advice.
Stay ahead of the market!
Subscribe now to our mailing list and receive the latest market news and insights delivered directly to your inbox.


Latest articles

European Currencies Decline: Pound Hits New Lows, Euro Under Pressure
European currencies continue to weaken against the US dollar amid rising geopolitical tensions and increased demand for safe-haven and liquid assets. Market participants are reducing exposure to riskier instruments, putting pressure on both the euro and the pound. Additional support

Market Analysis: GBP/USD Dips Further As EUR/GBP Regains Traction
GBP/USD failed to climb above 1.3500 and corrected some gains. EUR/GBP started a decent increase and might aim for more gains above 0.8700.
Important Takeaways for GBP/USD and EUR/GBP Analysis Today
· The British Pound
