


Gold Price (XAU/USD) Is Testing an Important Resistance Zone
FXOpen
On April 16, we wrote why the $2,380 zone is an important resistance area.

The XAU/USD chart shows that:
1) After fading fluctuations (they formed a narrowing consolidation triangle - shown in green), the price of gold dropped sharply (shown by a black arrow) on April 22-23.
2) Then, the price found support in the form of the lower border of the ascending channel (shown in blue), which has been in effect since the beginning of March. This led to the formation of another consolidation pattern between the blue lines.
3) An upward breakdown of the red lines on May 9 could be interpreted as an attempt by the bulls to resume the upward trend within the blue channel, but we could expect that the green triangle with its axis around 2380 would provide resistance.
However, it is important to pay attention to the nature of buyers’ behaviour when the price approaches an important resistance - the XAU/USD chart shows that the bulls’ persistence has quickly depleted. From the point of view of technical analysis of the gold price, a bearish engulfing has formed on the chart (shown by a blue arrow) in the area of 2380. In other words, the price of gold tested the resistance level, revealing the activity of bears defending their territory.
From the point of view of fundamental analysis, market participants can position themselves ahead of the key news for the beginning of the week: the CPI index will be published on Wednesday at 15:30 GMT+3.
But if economic or geopolitical news does not change the balance, in which, as we observe, the initiative is on the side of the bears, then this may create a threat of a breakdown of the blue channel’s lower border.
Start trading commodity CFDs with tight spreads (additional fees may apply). Open your trading account now or learn more about trading commodity CFDs with FXOpen.
This article represents the opinion of the Companies operating under the FXOpen brand only. It is not to be construed as an offer, solicitation, or recommendation with respect to products and services provided by the Companies operating under the FXOpen brand, nor is it to be considered financial advice.
Stay ahead of the market!
Subscribe now to our mailing list and receive the latest market news and insights delivered directly to your inbox.


Latest articles
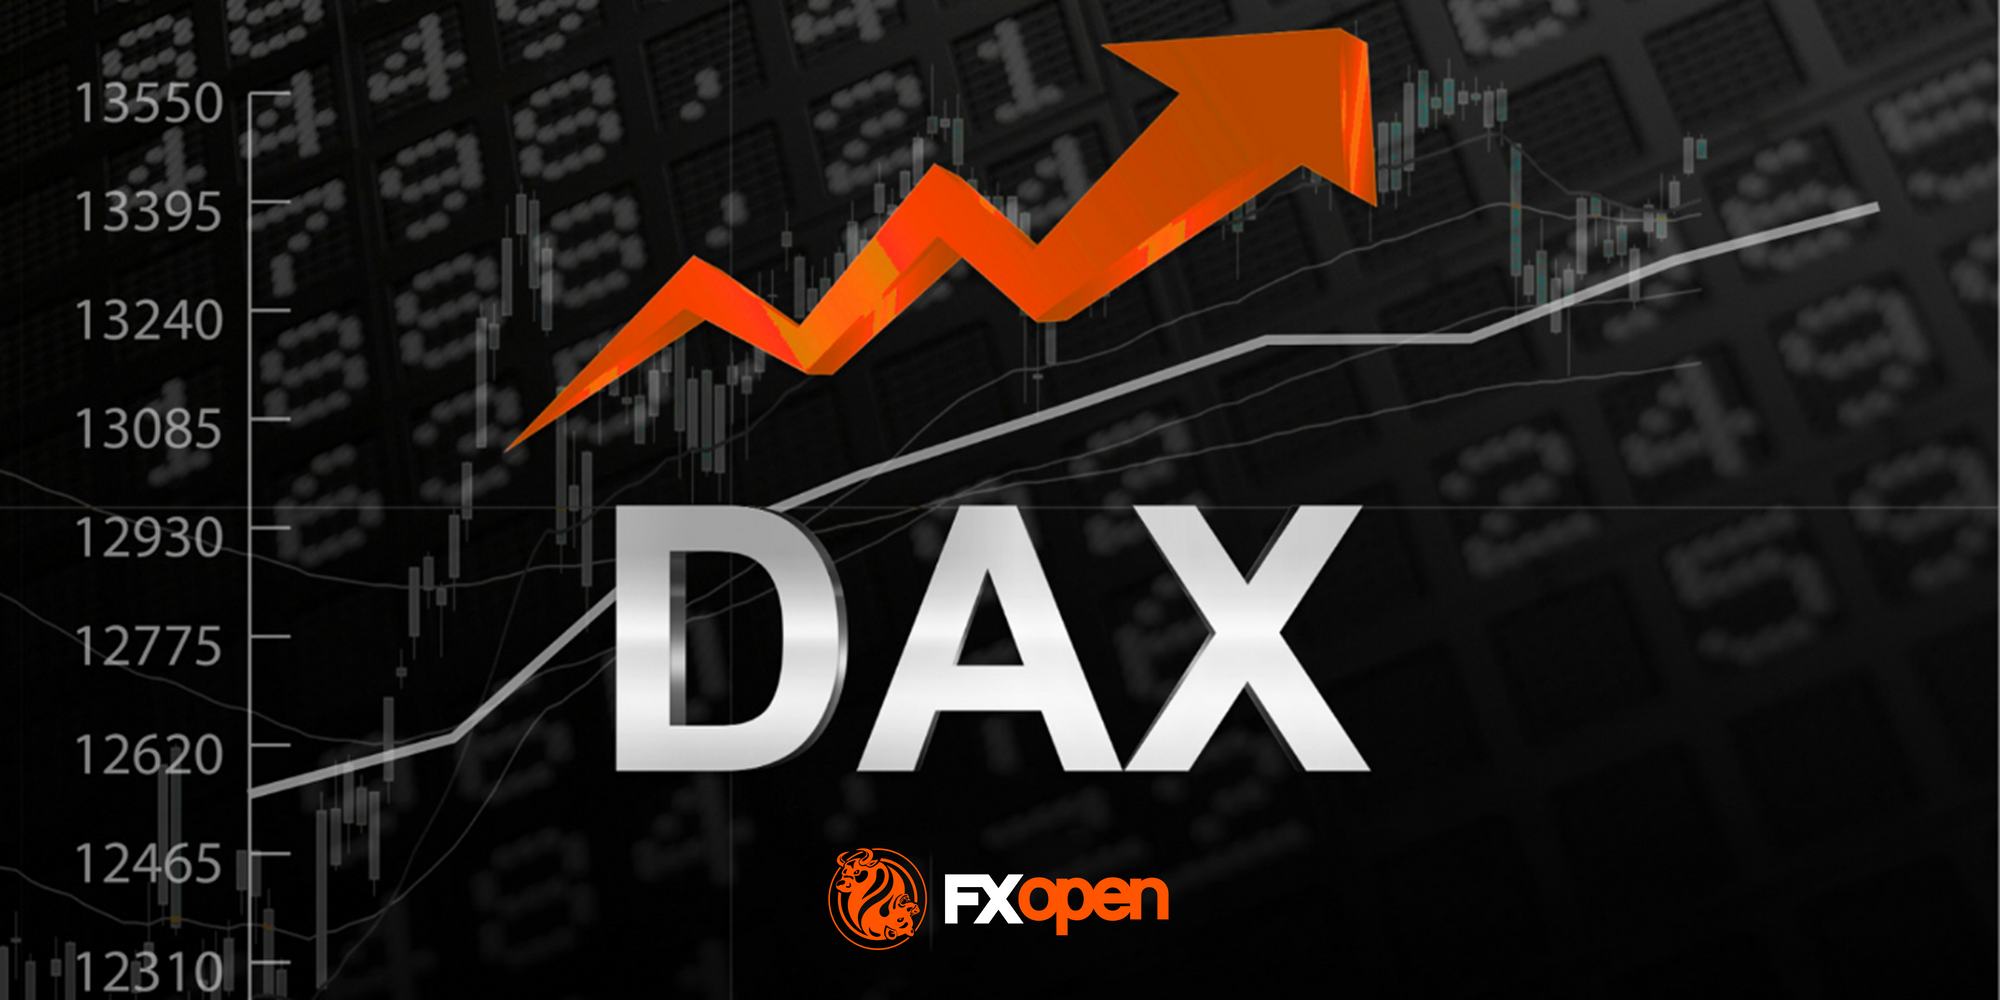
DAX 40: Can the Index Print Fresh Record Highs Once Again?
The DAX 40 has shed more than 2% over the past several sessions, breaking a rally that had pushed the index to record highs on the back of Germany's fiscal pivot toward defence, infrastructure and climate spending. The pullback raises

US Dollar Consolidates Ahead of FOMC Minutes Release
The US dollar has entered a period of consolidation following last week's sharp price swings, as market participants turn their attention to the release of the Federal Reserve's latest meeting minutes. Investors are looking for additional guidance on the future

EUR/USD Analysis: Who Is in Control?
Two central banks, two hawkish tones — but only one dollar just took a hit. The ECB delivered a 25bp hike in June, its first since 2023, lifting the deposit rate to 2.25% as Middle East-driven energy costs pushed headline