


XAU/USD Gold Price Reaches an Important Resistance Zone
FXOpen

The XAU/USD gold chart today indicates that the historical record price of the metal is above USD 2,400 per ounce.
In addition to fears of a new round of inflation due to rising commodity prices, geopolitical tensions are seen as the most important reason for the growth. At the moment, there are both active military conflicts on the planet (Ukraine, Israel-Iran), and there is a threat of creating new ones (Taiwan, for example). The US national debt and upcoming elections may also act as a destabilizing factor.
Therefore, gold acts as a traditional safe-haven asset. According to Goldman Sachs analysts, gold is in an “unshakable bull market”, so they raised their gold price forecast from USD 2,300 to USD 2,700.
Since the beginning of 2024, the price of XAU/USD has risen 15%, setting a new all-time high of USD 2,425. Could the bull run continue further?
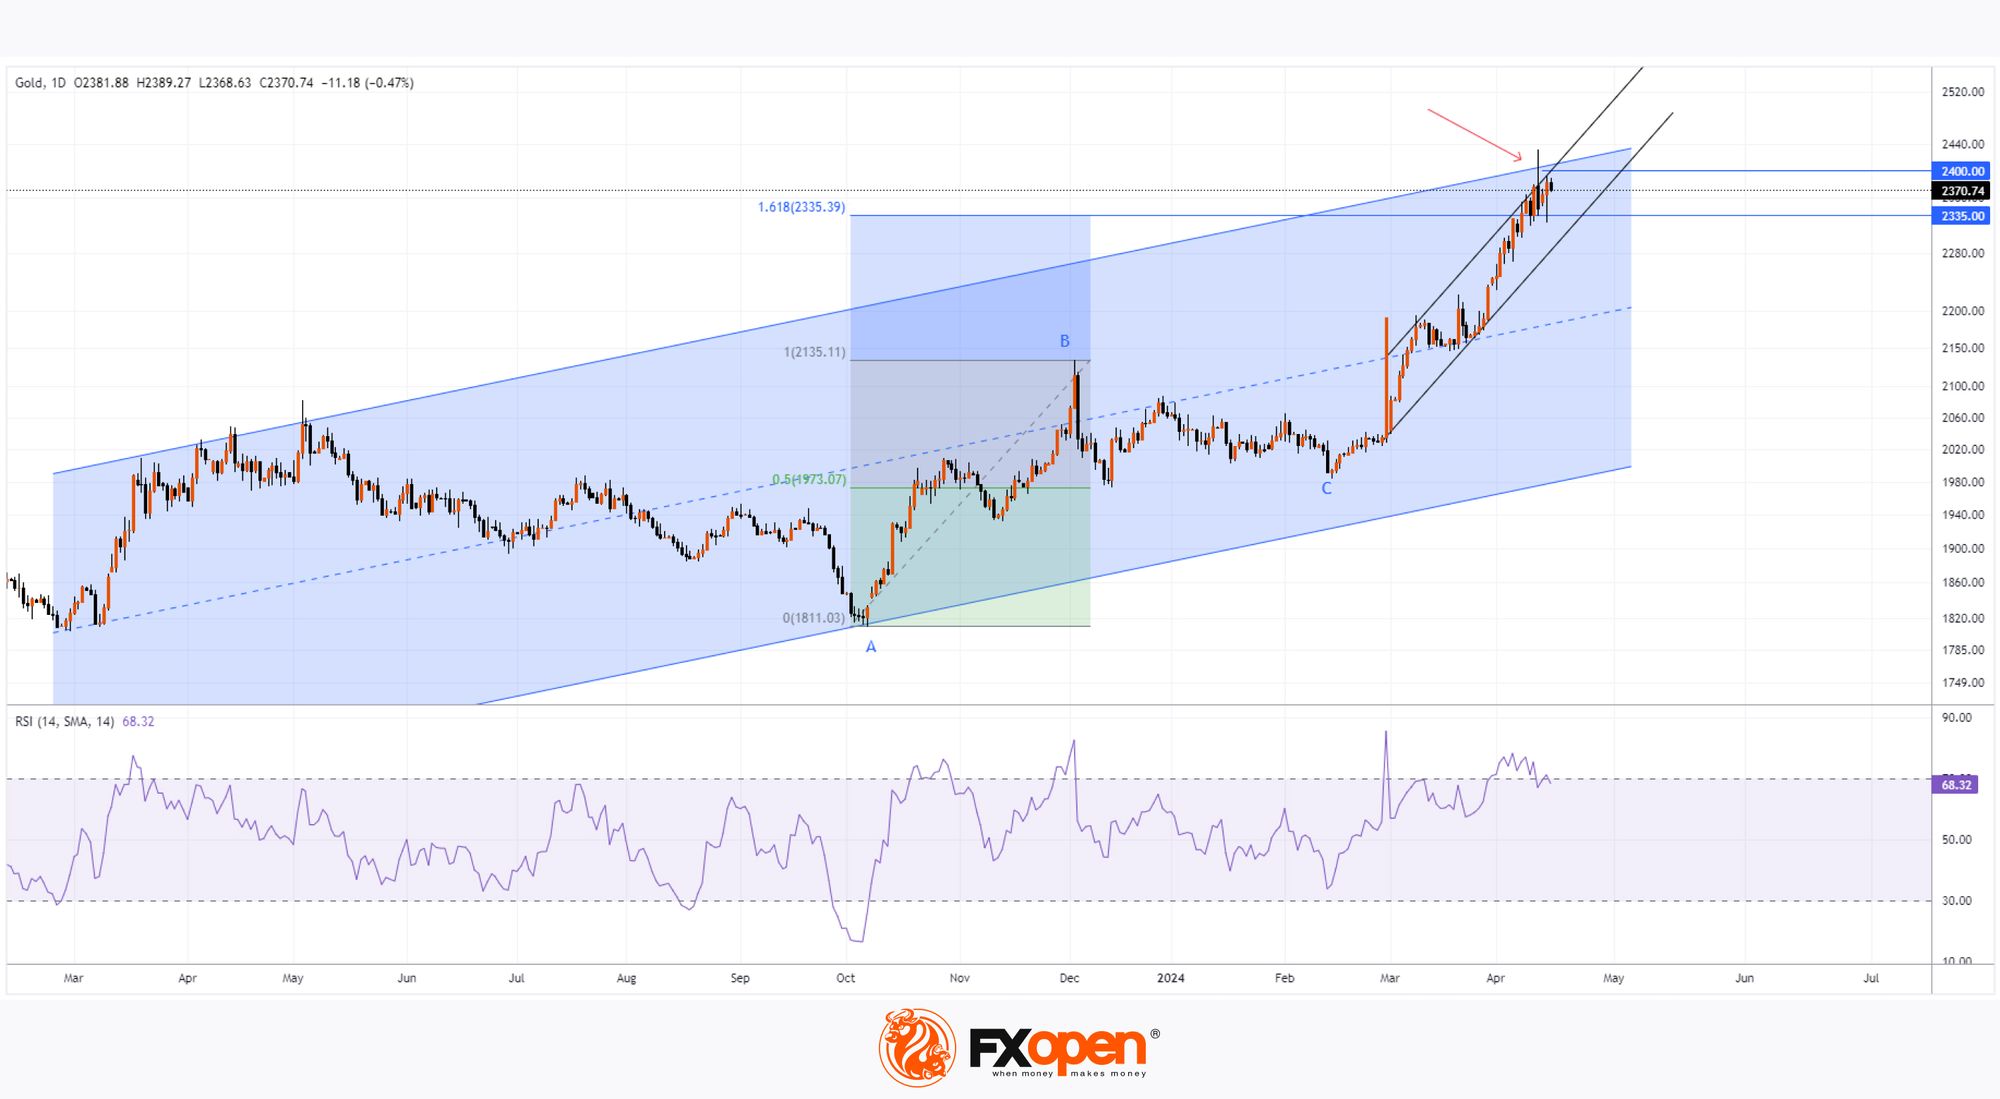
Although the fundamental backdrop remains tense, from a technical analysis perspective on gold prices, there are 4 important headwinds to consider:
→ the ascending channel (shown in blue). Today XAU/USD is near its upper line. As the arrow shows, the price of gold reacts to this line as resistance.
→ Psychological round level 2,400. Having exceeded it, the price quickly returned back.
→ The RSI indicator indicates that the market is overbought.
→ Fibonacci proportions. If we take impulse A→B as 100%, then the impulse price growth from point C has already exceeded the level = 1.618 (around 2,335), which could be the target.
On April 3, we wrote that the price of gold could rise to the level of 2,380. Now, in addition to the listed factors, it is worth taking into account the motive of some traders to take profits after a period of rising prices, which may contribute to the formation of a correction in the market - for example, to the lower intermediate channel lines (shown in black).
Start trading commodity CFDs with tight spreads (additional fees may apply). Open your trading account now or learn more about trading commodity CFDs with FXOpen.
This article represents the opinion of the Companies operating under the FXOpen brand only. It is not to be construed as an offer, solicitation, or recommendation with respect to products and services provided by the Companies operating under the FXOpen brand, nor is it to be considered financial advice.
Stay ahead of the market!
Subscribe now to our mailing list and receive the latest market news and insights delivered directly to your inbox.


Latest articles

AI Valuations Are Back in the Spotlight
Artificial intelligence remains the dominant investment theme of 2026, but investors are increasingly questioning whether AI stock valuations are keeping pace with reality.
💰 Big Tech continues to invest at an unprecedented scale, with hyperscaler AI spending projected to exceed $800

AUD/CAD: Months of Indecision — Is a Breakout Finally Coming?
The Australian dollar has clawed back most of its end-of-June losses, when it touched three-month lows against the greenback amid escalating Middle East tensions. Since then, sentiment has improved: the RBA's Assistant Governor Sarah Hunter signalled the board stands ready

USD/JPY: Battling at the Top of the Triangle
On 3 July, Japan's Finance Minister, Satsuki Katayama, stated that the Ministry of Finance remains in close contact with US authorities regarding developments in USD/JPY as the yen traded near its weakest level in almost 40 years. Similar verbal