


Gold Price XAU/USD Sets Another All-time High
FXOpen

The XAU/USD gold chart today indicates that the price of the metal has exceeded USD 2,250 per ounce.
Causes:
→ Geopolitical tensions. Military conflicts in Ukraine and the Middle East do not subside, the threat of terrorist attacks is growing, and new hot spots may appear on the world map.
→ Concerns about a new round of inflation due to rising commodity prices.
In both cases, gold acts as a safe-haven asset.
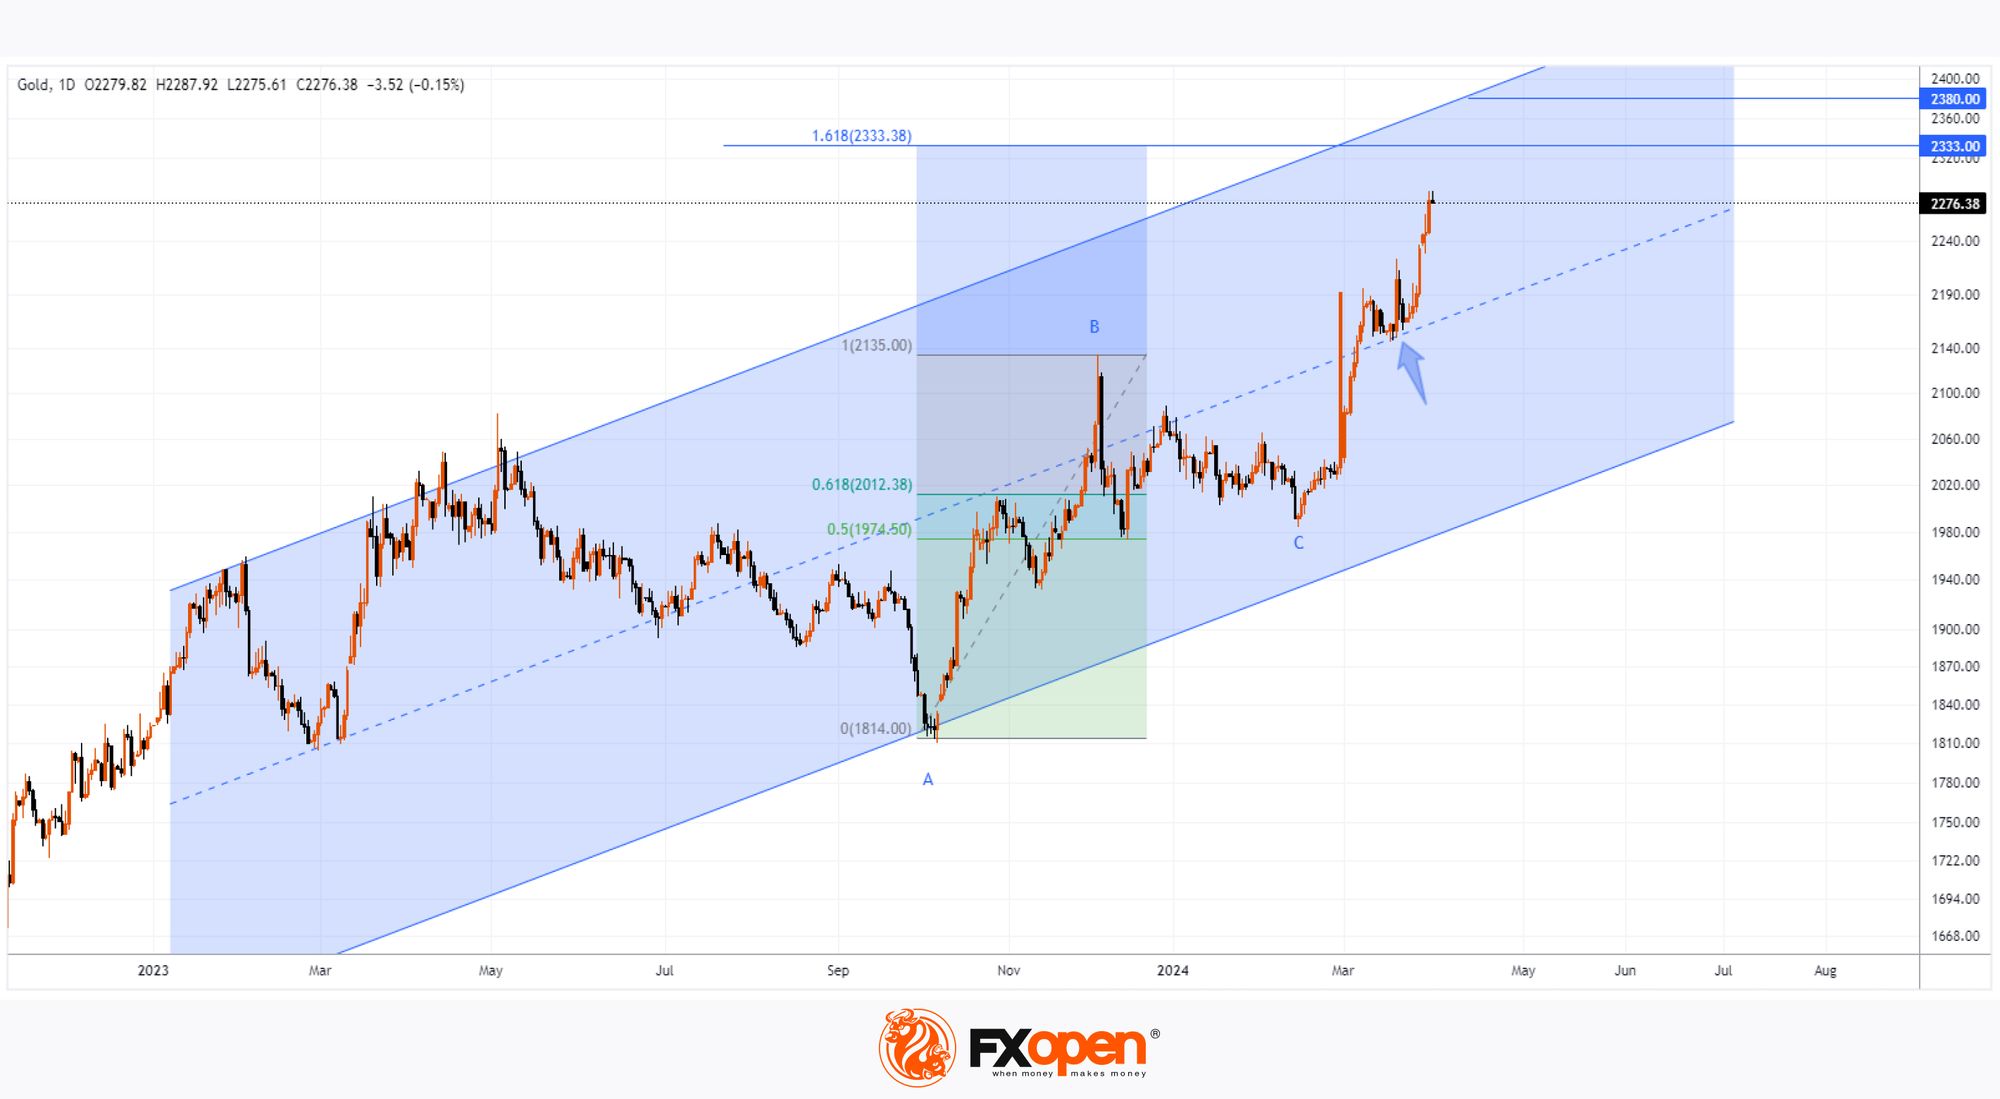
Since the beginning of 2024, the price of XAU/USD has risen by 12%. How much longer can the rally last?
In terms of technical analysis of the gold price, there are two tools to take into account:
→ ascending channel (shown in blue). Today XAU/USD is in its upper half, the price has tested (shown by the arrow) the support of the median line. And from the first days of April it has been demonstrating dynamics that direct it towards the upper border of the channel.
→ Fibonacci proportions. If we take the A→B impulse as 100%, then the decrease in B→C finds support in the zone of levels 0.5-0.618, which confirms the relevance of using proportions. Then the target for impulse price growth from point C may be the level of 1.618.
Thus, these technical analysis tools for the XAU/USD chart indicate that the price of gold may rise to the 2,333-2,380 zone if the current bullish sentiment continues.
Start trading commodity CFDs with tight spreads (additional fees may apply). Open your trading account now or learn more about trading commodity CFDs with FXOpen.
This article represents the opinion of the Companies operating under the FXOpen brand only. It is not to be construed as an offer, solicitation, or recommendation with respect to products and services provided by the Companies operating under the FXOpen brand, nor is it to be considered financial advice.
Stay ahead of the market!
Subscribe now to our mailing list and receive the latest market news and insights delivered directly to your inbox.


Latest articles

AI Valuations Are Back in the Spotlight
Artificial intelligence remains the dominant investment theme of 2026, but investors are increasingly questioning whether AI stock valuations are keeping pace with reality.
💰 Big Tech continues to invest at an unprecedented scale, with hyperscaler AI spending projected to exceed $800

AUD/CAD: Months of Indecision — Is a Breakout Finally Coming?
The Australian dollar has clawed back most of its end-of-June losses, when it touched three-month lows against the greenback amid escalating Middle East tensions. Since then, sentiment has improved: the RBA's Assistant Governor Sarah Hunter signalled the board stands ready

USD/JPY: Battling at the Top of the Triangle
On 3 July, Japan's Finance Minister, Satsuki Katayama, stated that the Ministry of Finance remains in close contact with US authorities regarding developments in USD/JPY as the yen traded near its weakest level in almost 40 years. Similar verbal