


FXOpen
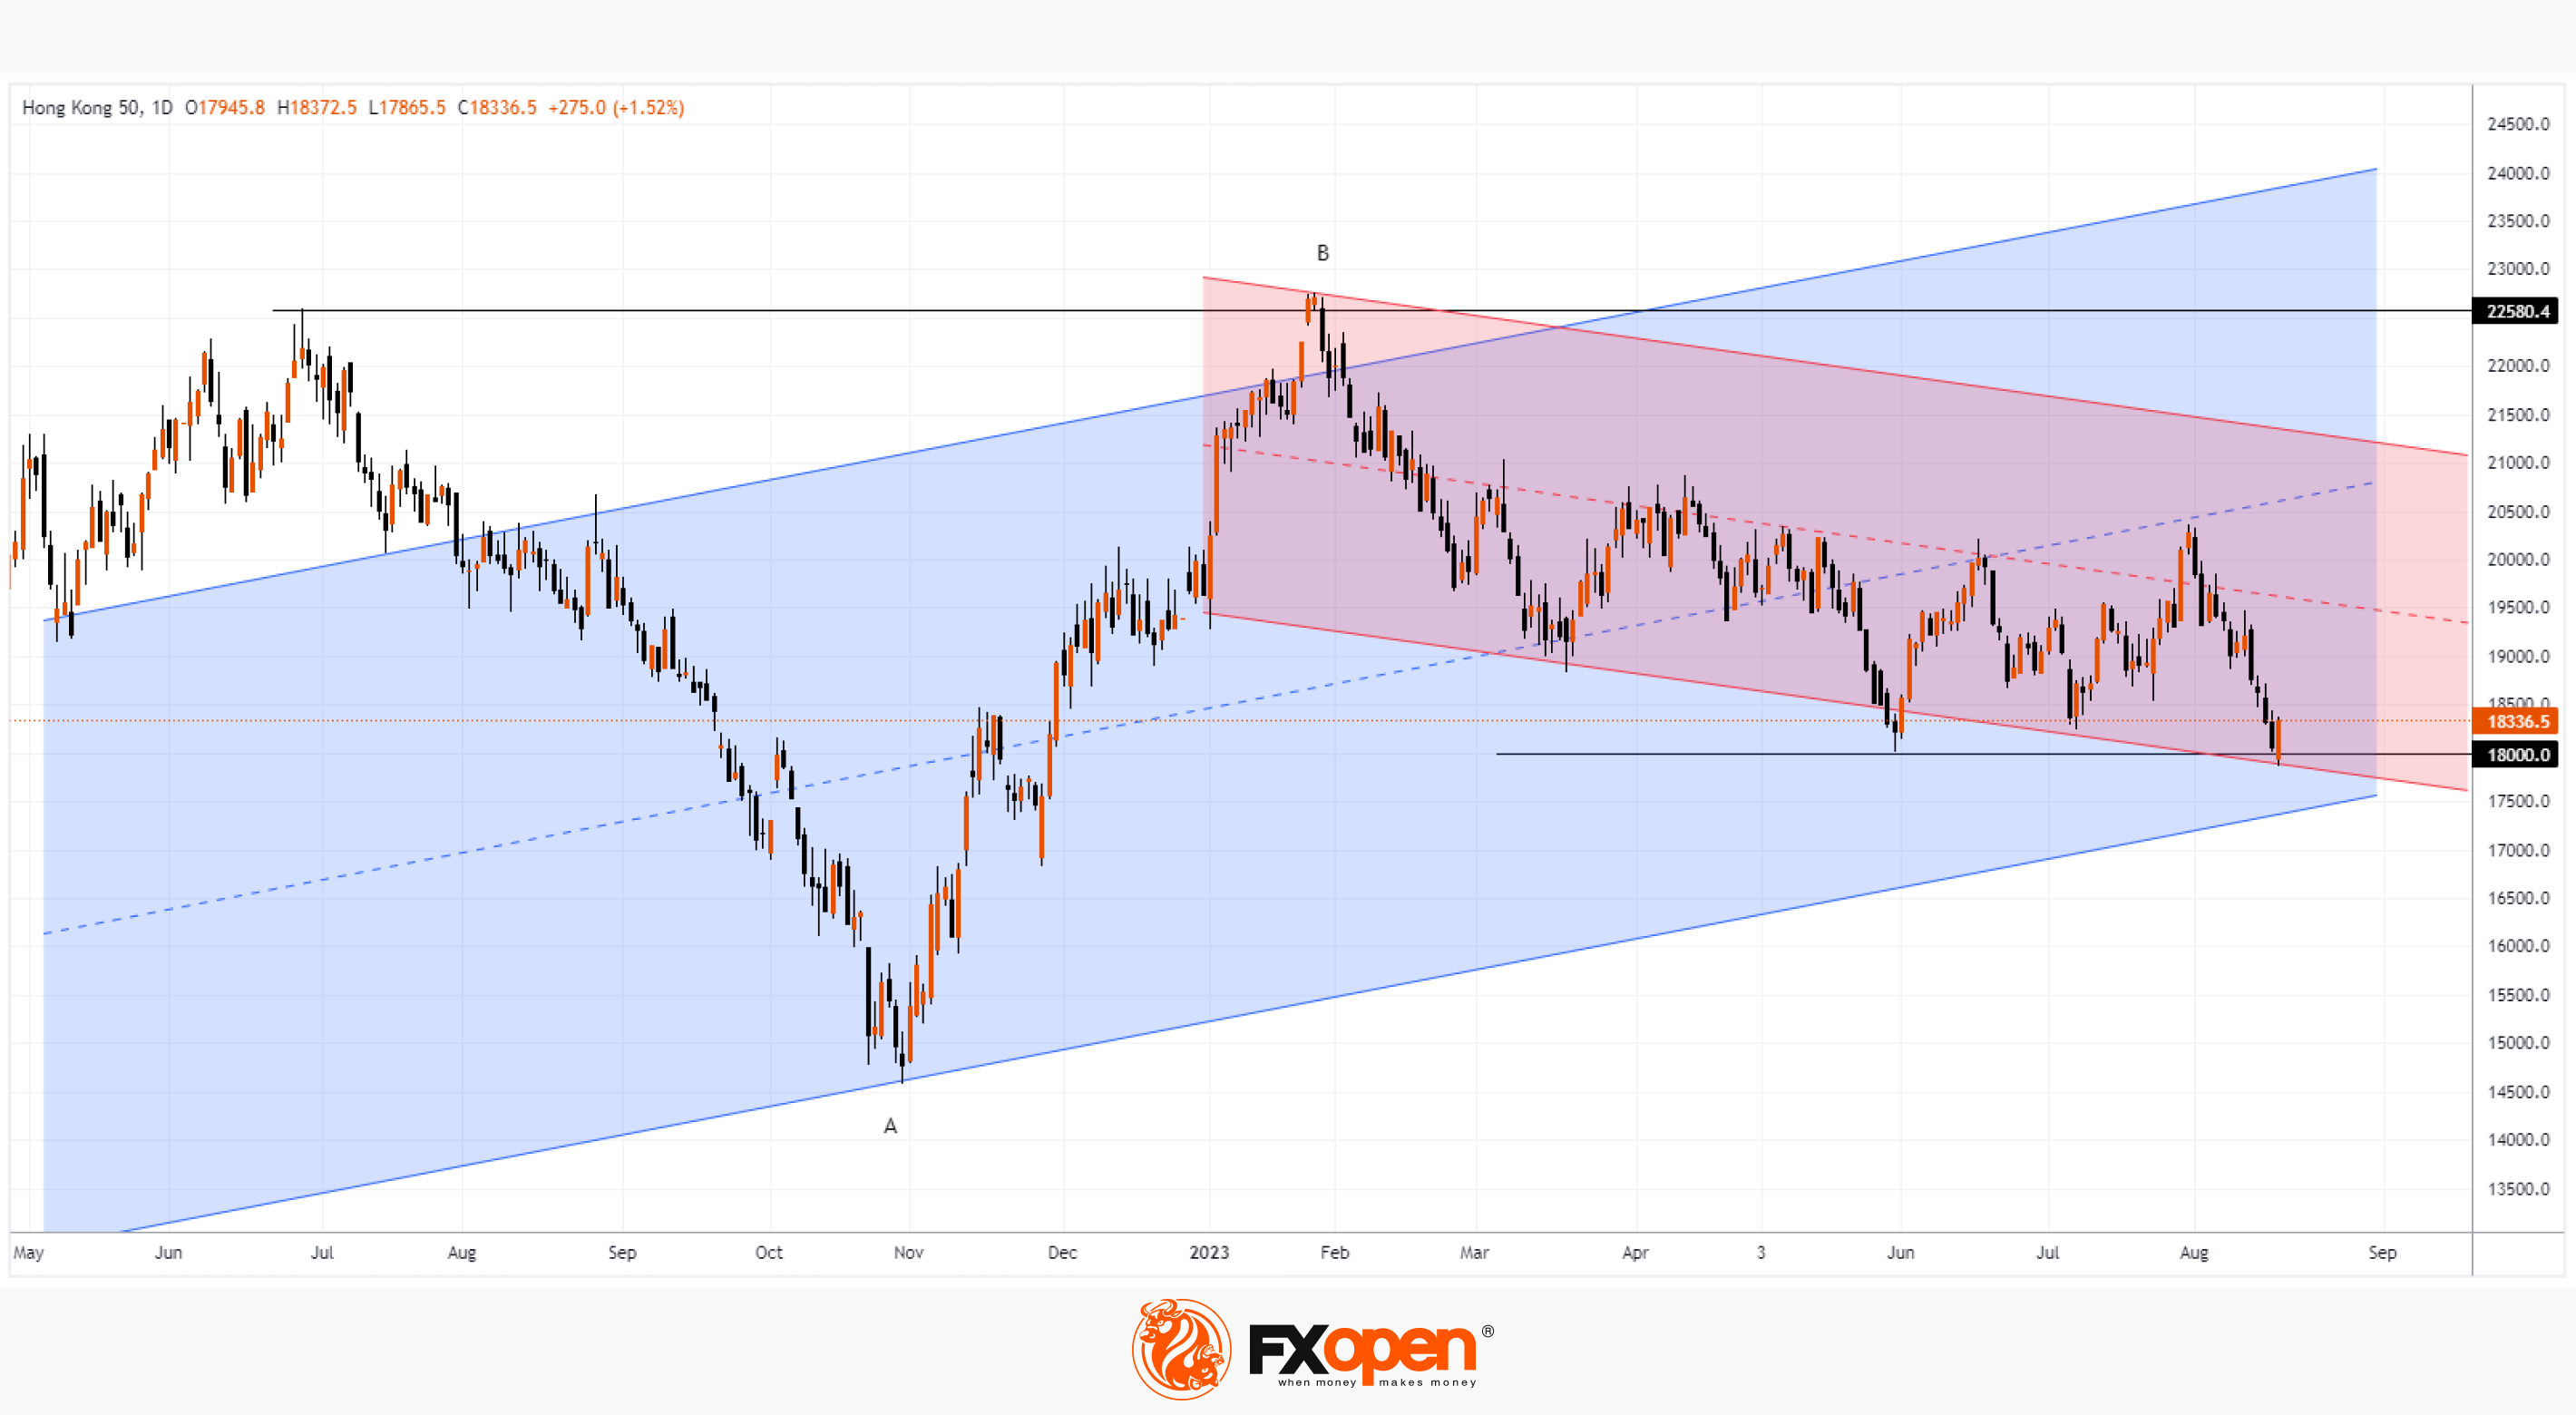
Today, the price of the Hang Seng index fell below the level of 18,000 for the first time since November 2022. The media is publishing materials about the slowdown in the Chinese economy (which is confirmed by statistics) and the lack of expected government stimulus.
The FT writes that foreign investors have canceled purchases of Chinese shares worth USD 7.4 billion, which were made following a July 24 pledge by the Chinese Communist Party Politburo to increase support for the economy. And according to data released by the Chinese currency regulator on Wednesday, the volume of bonds of foreign institutional investors fell by USD 5 billion in July.
However, not everything is so bad.
Bullish arguments:
→ The price of the Hang Seng index rose rapidly after breaking through the psychological level at 18,000.
→ Also, at the close of today's candlestick, a false bearish breakdown of the previous low of the year, recorded on the last day of May, may form. Pay attention to the false bullish breakdown at the end of January — perhaps a mirror image situation is happening.
→ The price is near the lower line of the ascending channel, shown in blue (which is not quite obvious yet).
→ The price is near the lower line of the descending channel shown in red.
→ The price is near the level of 50% of the increase in A→B.
If the price of the Hang Seng index rises from a block of listed supports, this will be another example of how market lows are accompanied by negative media.
Trade global index CFDs with zero commission and tight spreads (additional fees may apply). Open your FXOpen account now or learn more about trading index CFDs with FXOpen.
This article represents the opinion of the Companies operating under the FXOpen brand only. It is not to be construed as an offer, solicitation, or recommendation with respect to products and services provided by the Companies operating under the FXOpen brand, nor is it to be considered financial advice.
Stay ahead of the market!
Subscribe now to our mailing list and receive the latest market news and insights delivered directly to your inbox.


Latest articles

Silver Price Breaks February Resistance Line
As seen on the XAG/USD chart, silver has today breached the upper boundary of the descending channel formed by February’s lower highs and lows.
Bullish sentiment is supported by heightened geopolitical tensions and rising demand for safe-haven assets.
BTC/USD Analysis: Are the Bulls Stirring?
According to media reports, Bitcoin’s fall from its all-time high in October 2025 to February’s low near $60k triggered the largest outflow from spot Bitcoin ETF funds since their launch in January 2024.
Glassnode data show that more

Nvidia Stock Price Targets for 2026-2030: What Analysts Think
Nvidia (NVDA) is one of