


FXOpen

As the chart shows, Hong Kong’s Hang Seng Index (Hong Kong 50 on FXOpen) has fallen more than 3% from its 2025 high over the past week. In recent days, several factors may have driven bearish sentiment:
→ Domestic Chinese policy: Media reports indicate that on Monday the head of China’s central bank held a press conference, but market participants may have been disappointed by the proposed economic stimulus measures.
→ US influence: This includes both trade deal negotiations and the Federal Reserve’s recent decision to cut interest rates.
→ Other news: For example, the approach of Typhoon Ragas.
Additionally, reaching a peak near 27,000 points may have prompted long-position holders to take profits, creating a wave of selling.
Nevertheless, the chart shows several technical signs suggesting that the market is finding support, and the scope for further declines appears limited.
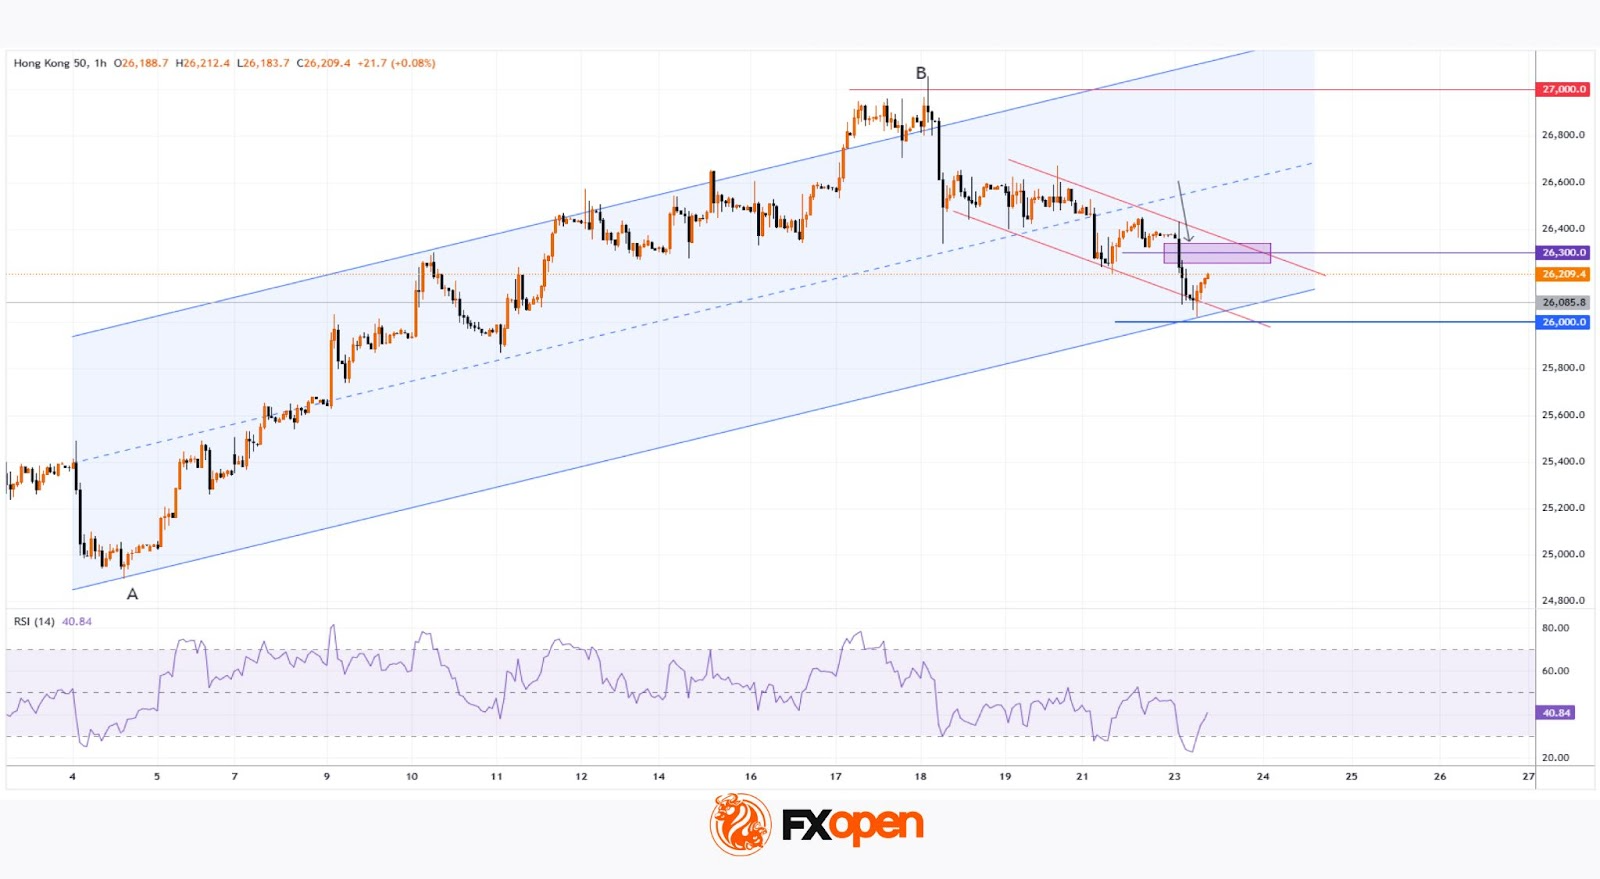
Technical Analysis of the Hang Seng Index Chart
Market movements in September have formed an ascending channel (shown in blue), with support provided by:
→ the lower boundary of this channel;
→ the psychological level of $26,000;
→ the 50% retracement level following the A→B impulse.
Bulls may take confidence from the fact that the RSI is in oversold territory.
In the short term, the initiative remains with the bears:
→ they are holding the Hang Seng stock price within a descending trajectory (shown in red);
→ the break below the 26,300 level occurred aggressively (marked with an arrow) — wide candles indicate a seller-dominated imbalance, making the consideration of a bearish Fair Value Gap pattern (highlighted in purple) relevant.
However, in the longer term, the odds favour the bulls:
→ the index has risen approximately 30% since the start of 2025;
→ in this context, we may be inside a Bullish Flag pattern, suggesting a potential resumption of the prevailing uptrend after an intermediate correction.
Trade global index CFDs with zero commission and tight spreads (additional fees may apply). Open your FXOpen account now or learn more about trading index CFDs with FXOpen.
This article represents the opinion of the Companies operating under the FXOpen brand only. It is not to be construed as an offer, solicitation, or recommendation with respect to products and services provided by the Companies operating under the FXOpen brand, nor is it to be considered financial advice.
Stay ahead of the market!
Subscribe now to our mailing list and receive the latest market news and insights delivered directly to your inbox.


Latest articles

Market Analysis: Gold Price Slips Back, WTI Crude Oil Rally Gains Fresh Strength
Gold price rallied above $4,750 before correcting lower. Crude oil prices are rising and could climb further higher toward $110.00.
Important Takeaways for Gold and WTI Crude Oil Prices Analysis Today
· Gold price gained pace for a move

Consolidation Ahead of NFP: Commodity Currencies Search for Direction
Commodity-linked currencies have entered a consolidation phase following recent directional moves, as market participants adopt a wait-and-see approach ahead of key US labour market data. Current price action reflects a balance between ongoing demand for the US dollar and attempts

The Real Driver Behind the Dollar Rally: Market Insights with Gary Thomson
The US dollar has been firm, but the drivers behind the move may be more complex than they first appear.
While geopolitical tension and shifts in risk sentiment play a role, current price behaviour seems increasingly influenced by inflation expectations