


FXOpen

As shown on the Hang Seng Index chart (Hong Kong 50 on FXOpen), prices have fallen by almost 10% since trading began today, and the session is not over yet.
According to Reuters, bearish sentiment was driven by uncertain statements from Chinese officials regarding economic stimulus measures. This has raised doubts in the stock market about Beijing's ability to steer the world’s second-largest economy out of its most severe downturn since the global pandemic, aiming to achieve 5% growth.
Additionally, the decline may have been accelerated by a cascade of long position closures, which were opened in mid-September when the Hang Seng Index (Hong Kong 50 on FXOpen) was in an upward trend.
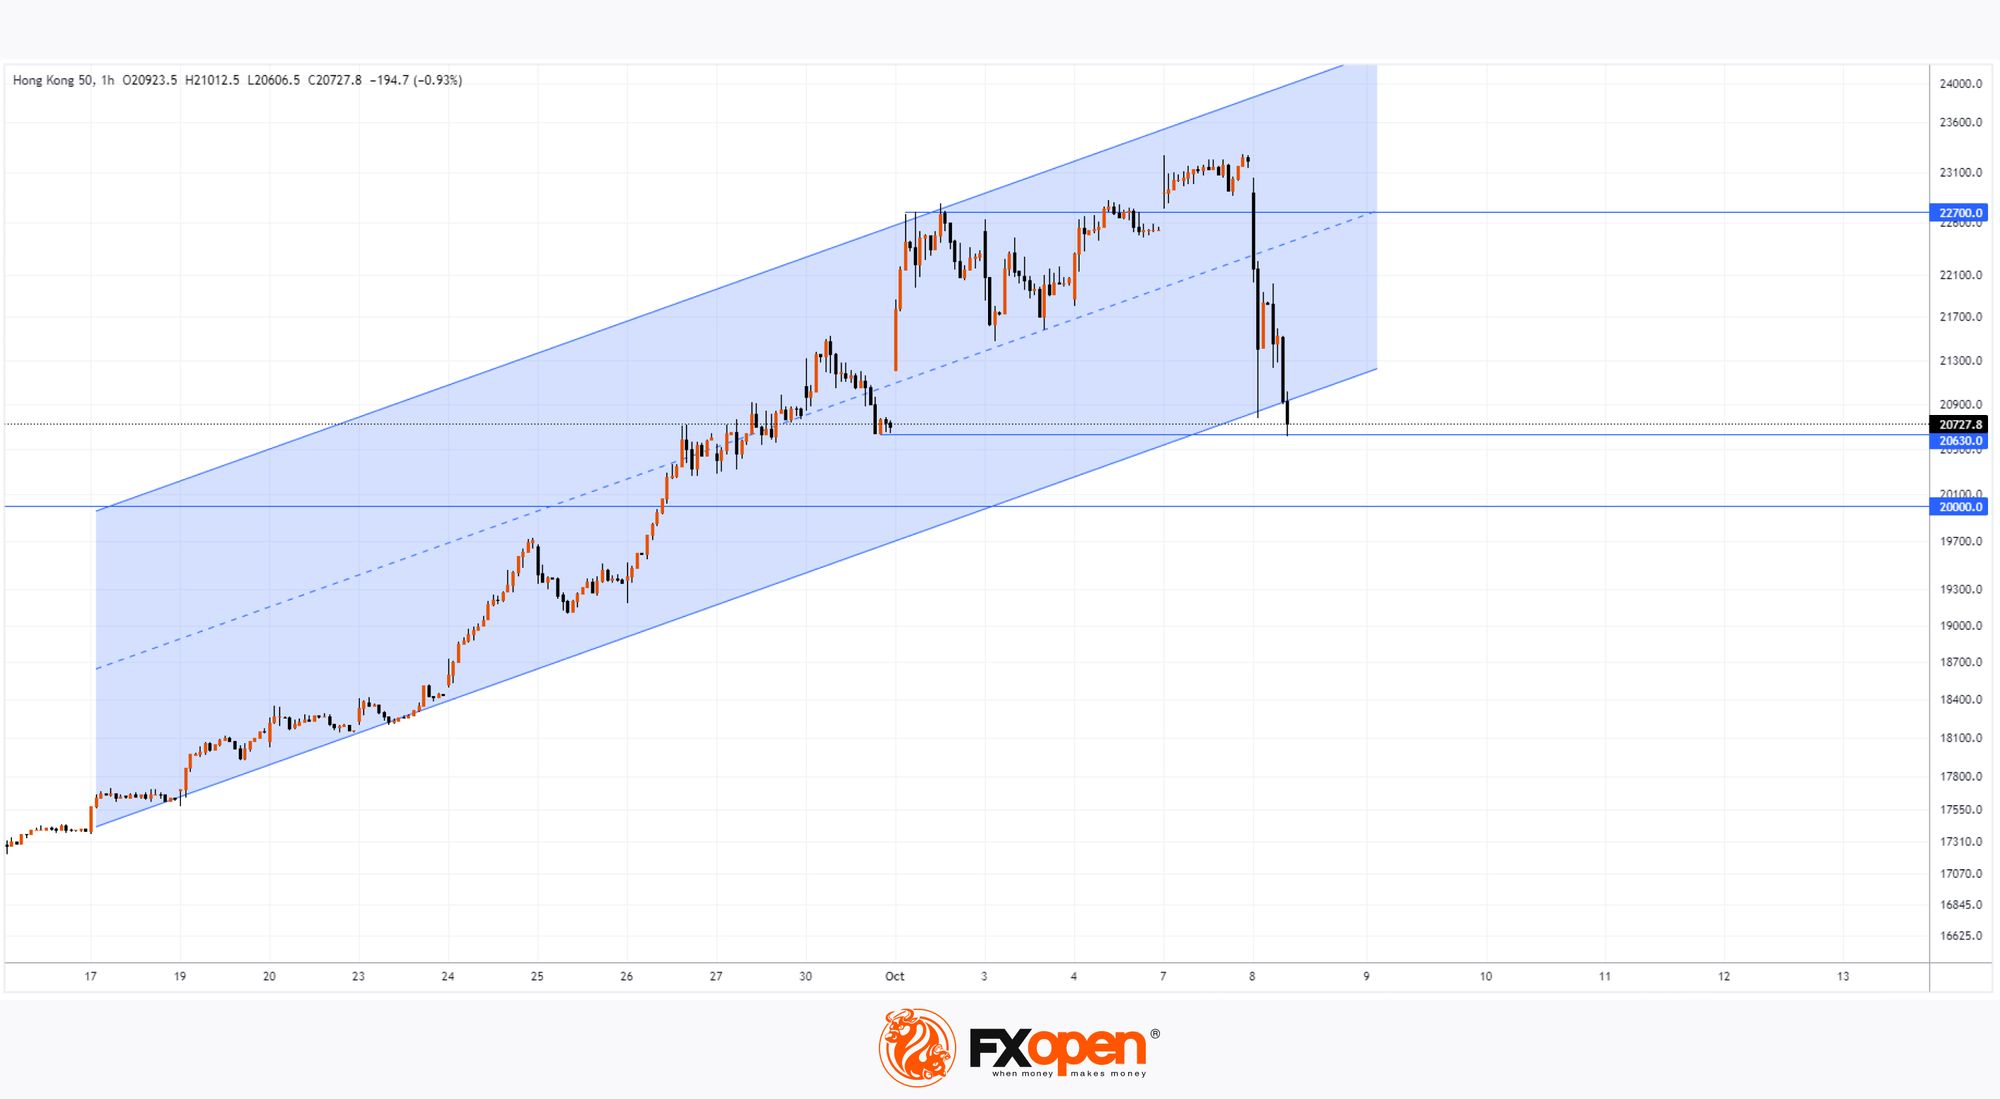
Hang Seng Index Technical Analysis (Hong Kong 50 on FXOpen):
→ The upward trend (marked in blue) is still intact, although the price is now near the lower boundary, posing a real risk of a break.
→ The price failed to hold above the 22,700 level, which could act as future resistance.
→ Support may come from the psychological level of 20,000 points and the September 30 low near 20,630.
It’s possible that the lower boundary of the blue channel and the support area between 20,000 and 20,630 could help bulls offset some of today's significant decline. However, for a sustainable continuation of the upward trend on the Hang Seng Index chart (Hong Kong 50 on FXOpen), the market will need clear evidence of economic stimulus from Chinese authorities.
Trade global index CFDs with zero commission and tight spreads (additional fees may apply). Open your FXOpen account now or learn more about trading index CFDs with FXOpen.
This article represents the opinion of the Companies operating under the FXOpen brand only. It is not to be construed as an offer, solicitation, or recommendation with respect to products and services provided by the Companies operating under the FXOpen brand, nor is it to be considered financial advice.
Stay ahead of the market!
Subscribe now to our mailing list and receive the latest market news and insights delivered directly to your inbox.


Latest articles

Market Analysis: GBP/USD Dips Further As EUR/GBP Regains Traction
GBP/USD failed to climb above 1.3500 and corrected some gains. EUR/GBP started a decent increase and might aim for more gains above 0.8700.
Important Takeaways for GBP/USD and EUR/GBP Analysis Today
· The British Pound


Market Insights with Gary Thomson: Oil, US Retail Sales & NFP in Focus
In this video, we’ll explore the key economic events and market trends, shaping the financial landscape. Get ready for insights into financial markets to help you navigate the week ahead. Let’s dive in!
In this episode of Market