


IBM Share Price Soars Nearly 10%
FXOpen

As the chart shows, the closing price on January 24 = USD 173.79, closing price on January 25 = USD 190.19. At yesterday's peak, IBM's share price was above USD 196, helped by a strong fourth-quarter earnings report that was positive about the company's prospects due to advances in AI.
→ Total revenue was USD 17.381 billion, compared to USD 16.690 billion in the prior-year quarter.
→ The acquisition of Red Hat made IBM the fifth-largest cloud service provider by market share. This is very important given the industry's projected growth rate of 16% per year until 2028.
→ Advances in quantum computing, exemplified by the release of the 127-qubit Eagle quantum chip.
In addition, the company has increased dividends for 28 years in a row, making IBM shares attractive to a wide range of investors.
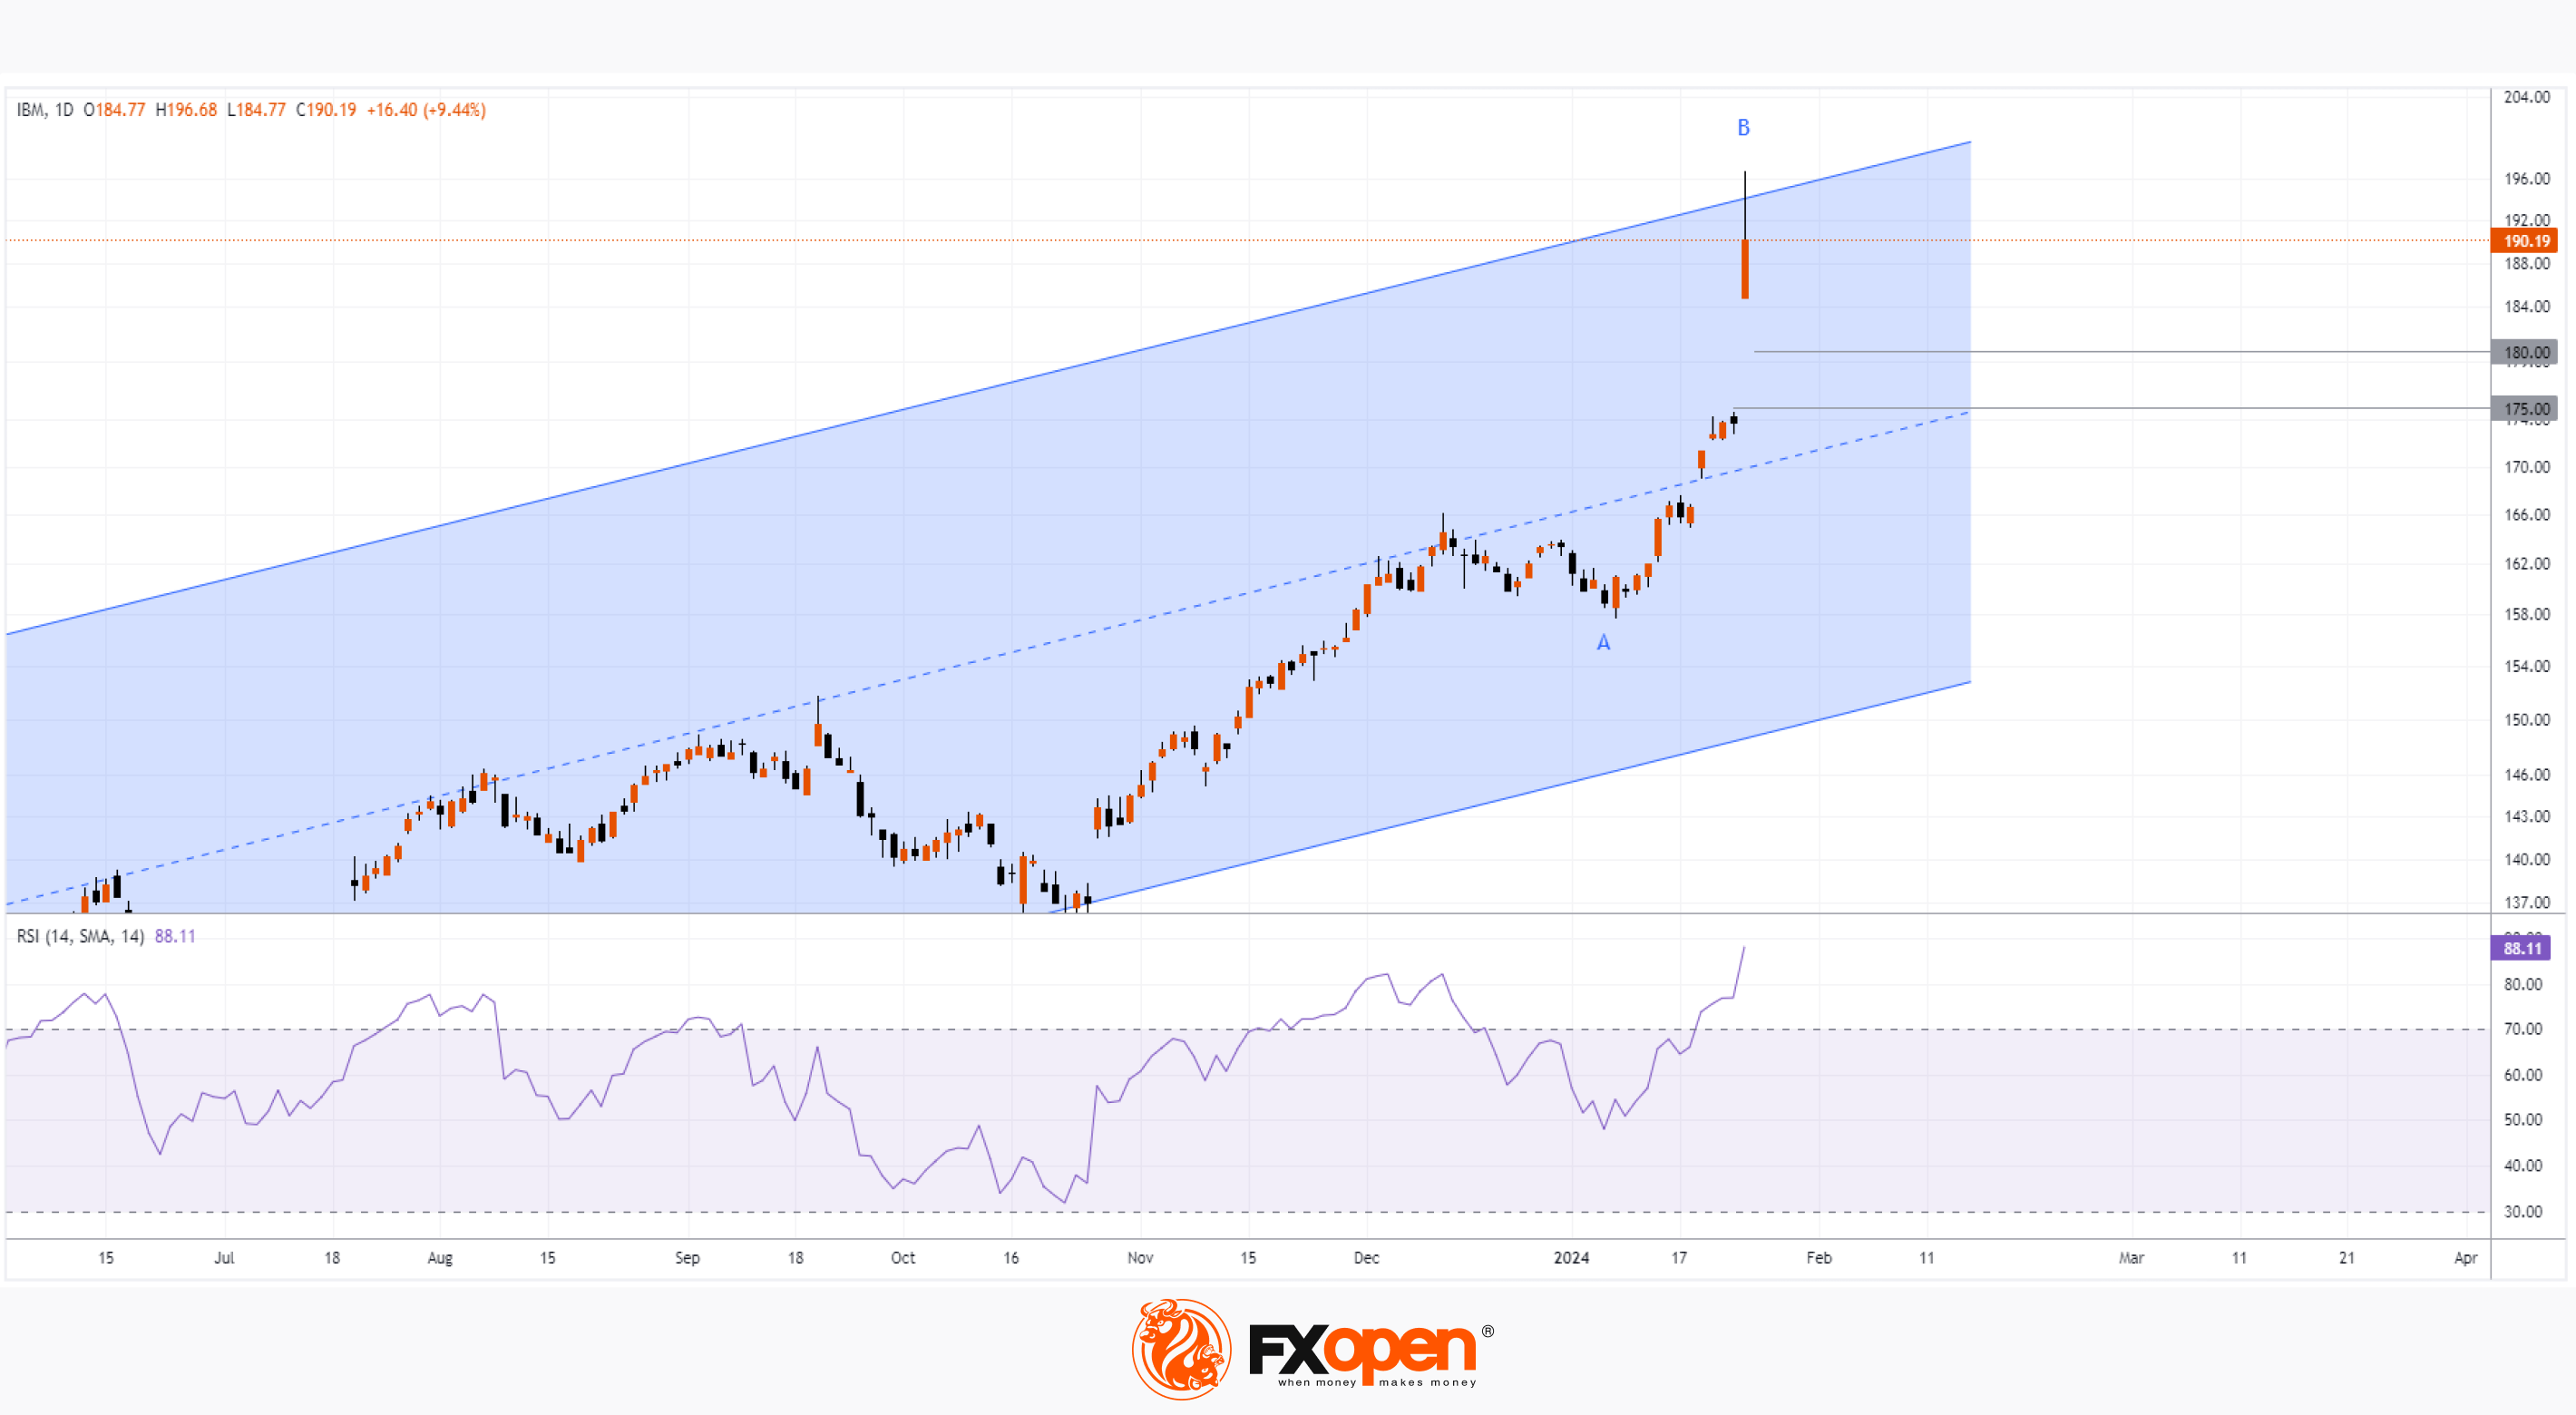
Technical analysis of the IBM stock price chart shows that:
→ the price has reached the upper border of the parallel channel (shown in blue);
→ the RSI indicator indicates strong overbought;
→ a long upper shadow formed on yesterday’s candle – a sign of sales activity. It is acceptable to assume that some investors rushed to take profits in order to later find an opportunity to re-enter a long position at lower prices.
Indeed, given the chart situation, IBM's share price is vulnerable to a pullback following the extremely positive report. If a pullback occurs, the price may find support in the area between the psychological levels of USD 175 and USD 180 per share of IBM, where the 50% Fibonacci level of the upward impulse A→B passes. The channel median line can also help the bulls.
Buy and sell stocks of the world's biggest publicly-listed companies with CFDs on FXOpen’s trading platform. Open your FXOpen account now or learn more about trading share CFDs with FXOpen.
This article represents the opinion of the Companies operating under the FXOpen brand only. It is not to be construed as an offer, solicitation, or recommendation with respect to products and services provided by the Companies operating under the FXOpen brand, nor is it to be considered financial advice.
Stay ahead of the market!
Subscribe now to our mailing list and receive the latest market news and insights delivered directly to your inbox.


Latest articles

Weekly Market Insights with Gary Thomson: The Week of Central Banks and Earnings
In this video, we’ll explore the key economic events and market trends, shaping the financial landscape. Get ready for insights into financial markets to help you navigate the week ahead. Let’s dive in!
In this episode of Market

Intel at a Crossroads: Earnings Beat Meets Technical Resistance
Intel has just delivered its strongest quarter in over fifteen years, and the market reaction says it all. Q2 2026 revenue surged 25% year-over-year to $16.1 billion, crushing the consensus estimate of $14.42 billion, while adjusted EPS of

Tesla: Complex Range Structure Breaks Down Following Quarterly Earnings
Tesla released its Q2 2026 results after the market closed on 22 July. Revenue increased 26% year-on-year to $28.24 billion, while vehicle deliveries reached a record 480,126 units. However, operating margin fell sharply to 1.4%, down from