


FXOpen

The opening price on Friday was around 1,870, the closing price was around 1,930. The reason for the rapid growth of the XAU/USD quote is geopolitical tension. Israeli forces announced a ground operation in the Gaza Strip, which may be why before the weekend the markets were dominated by the forces of demand for gold as a defensive asset.
The Chinese Foreign Ministry said Israel's actions went beyond self-defense. And the famous investor Ray Dalio expressed the opinion that the risk of global war is 50% due to the situation in the Middle East.
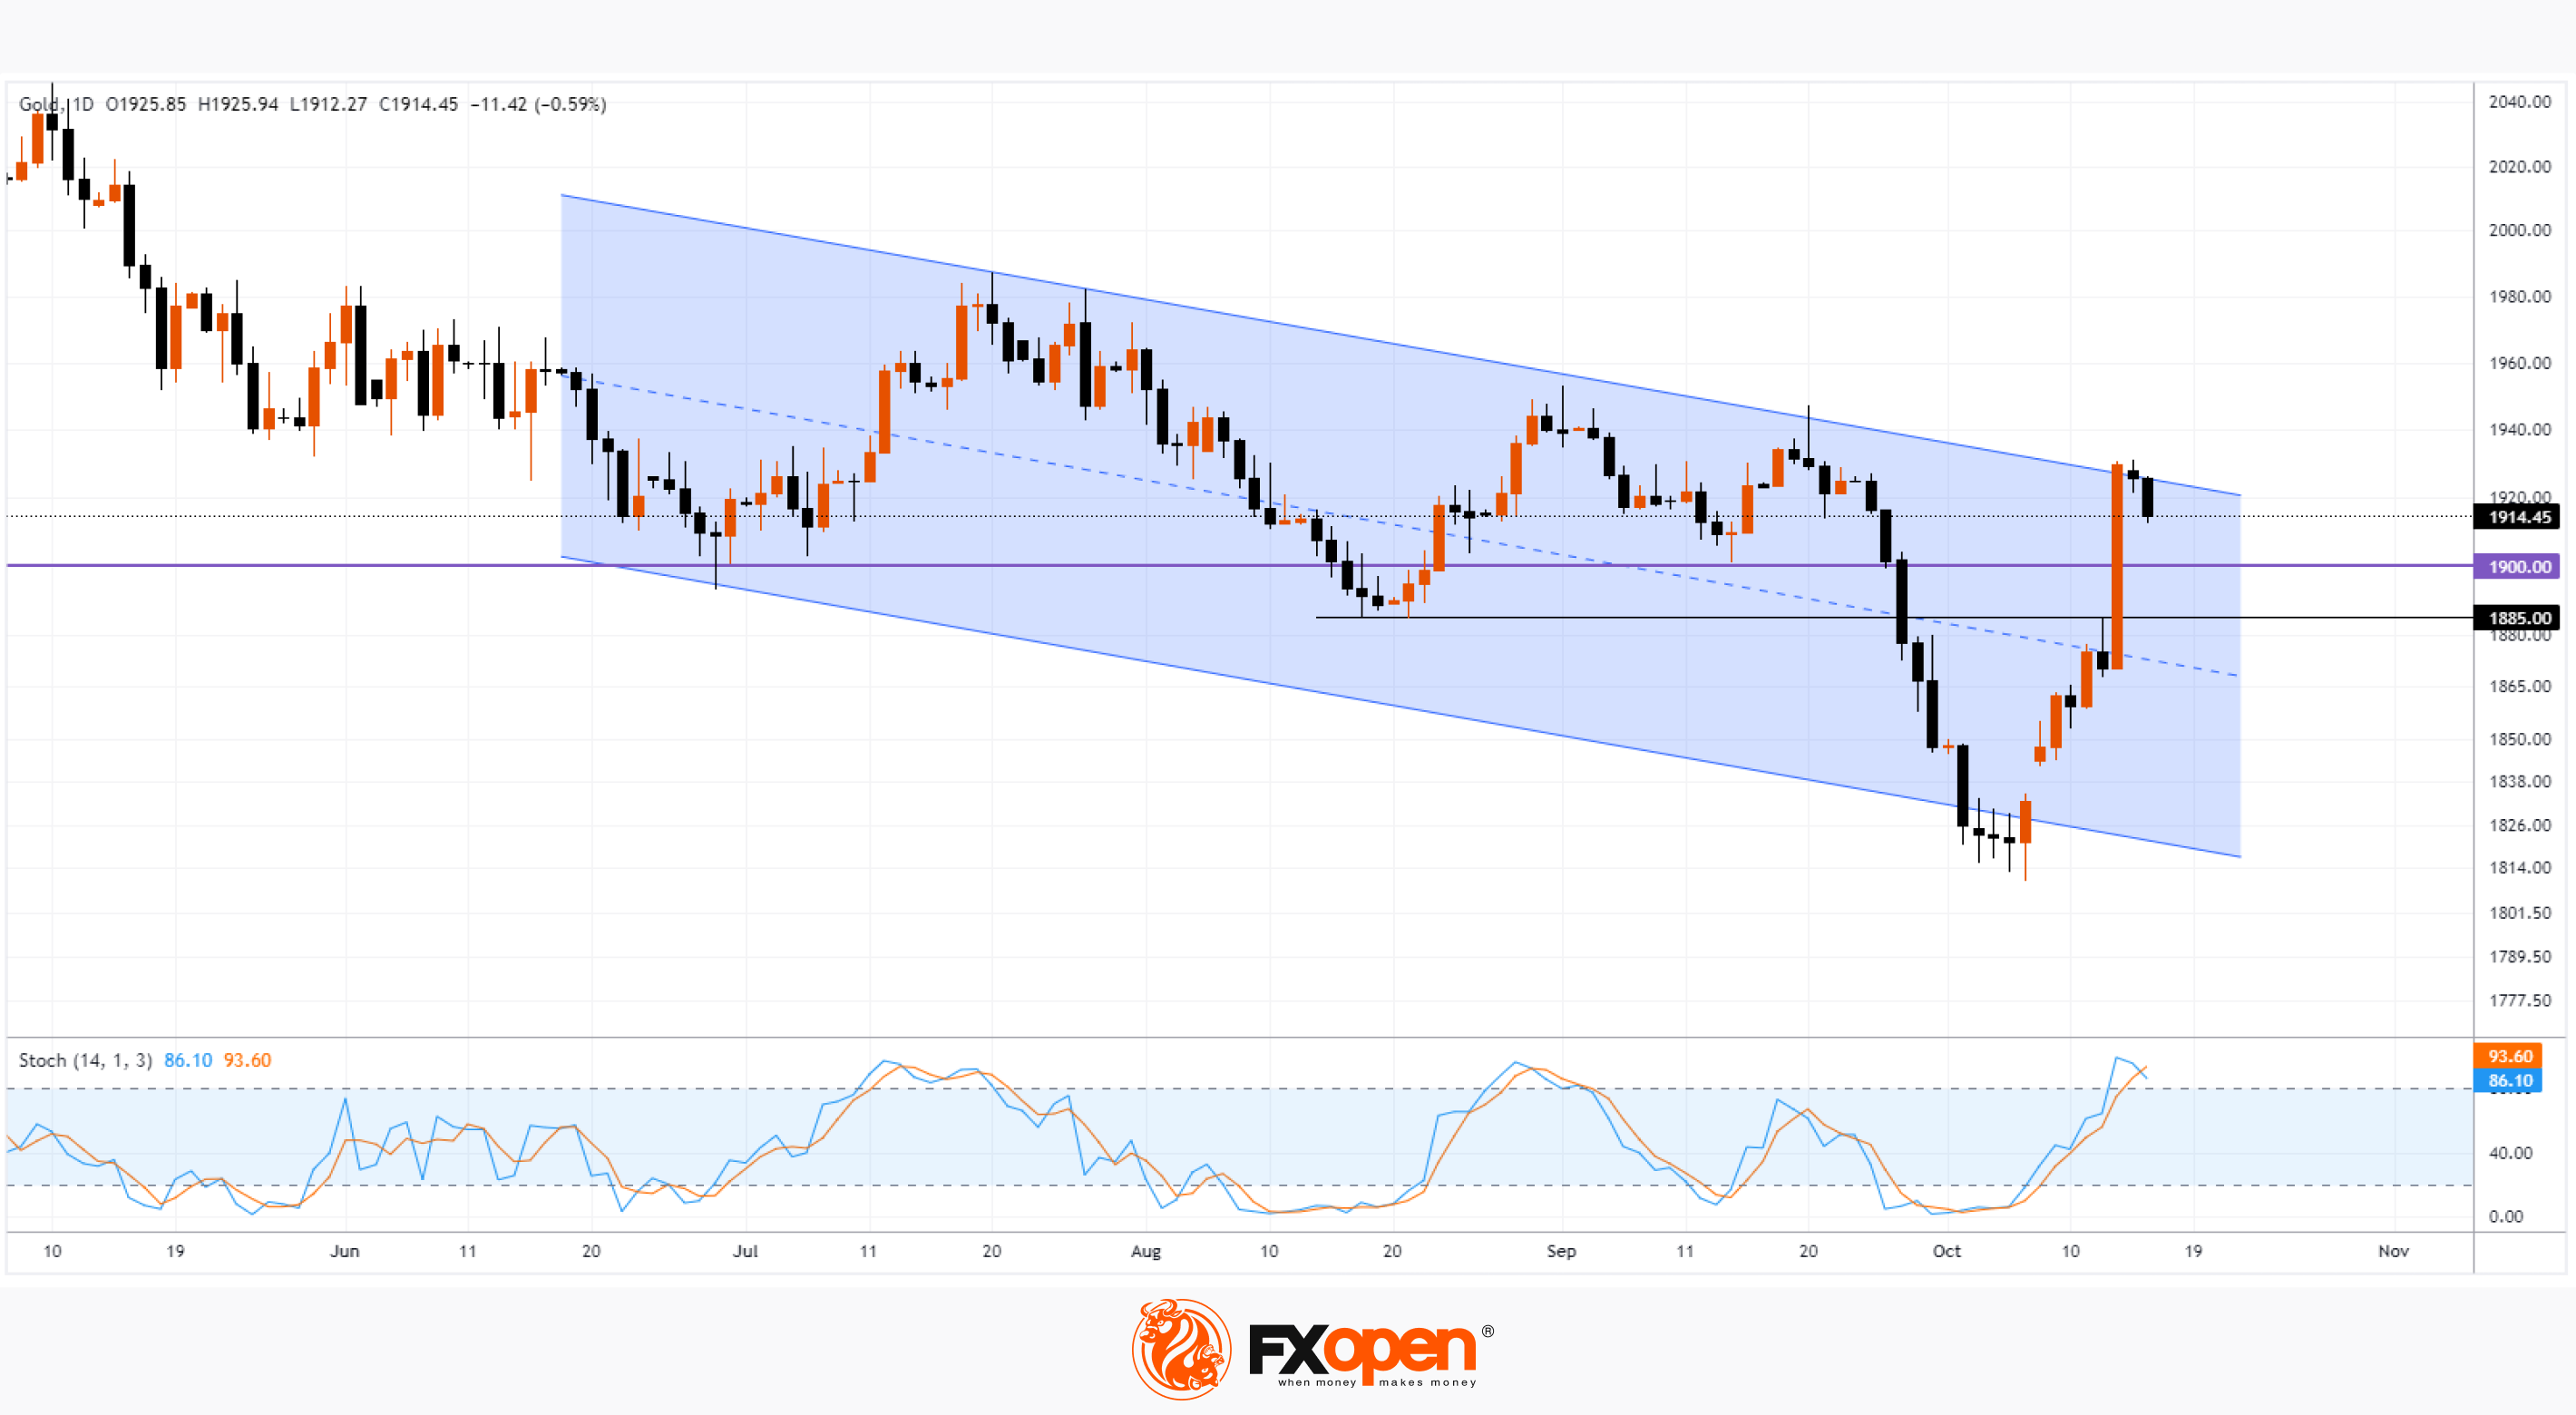
The XAU/USD chart shows that the price of gold has reached the upper limit of the downward channel.
Technically:
→ the price of gold may encounter resistance from the upper border;
→ the price may roll back from the overbought zone, which is indicated by the stochastic oscillator;
→ the price may be supported by the psychological level of 1,900;
→ support may be provided by the level of 1,885; previously the price formed reversals from it.
However, the main driver of the price of gold will likely remain the fundamental factor. Steps aimed at resolving the military conflict will help ensure that the price of gold remains within the descending channel that has been in effect since the first half of the year.
Start trading commodity CFDs with tight spreads (additional fees may apply). Open your trading account now or learn more about trading commodity CFDs with FXOpen.
This article represents the opinion of the Companies operating under the FXOpen brand only. It is not to be construed as an offer, solicitation, or recommendation with respect to products and services provided by the Companies operating under the FXOpen brand, nor is it to be considered financial advice.
Stay ahead of the market!
Subscribe now to our mailing list and receive the latest market news and insights delivered directly to your inbox.


Latest articles

EUR/USD Chart Analysis: Pair Recovers Ahead of Fed News
On 10 March, analysing the EUR/USD chart, we:
→ considered the long-term descending channel, which remains relevant;
→ noted that the sequence of lower lows A–H was broken with the appearance of a higher peak I, with 1.1680 potentially

Nvidia (NVDA) Shares Set a March High
Nvidia shares experienced heightened volatility yesterday, with the price jumping to a March high during the Nvidia GTC 2026 conference, where Jensen Huang made several major announcements. According to media reports:
→ Nvidia unveiled a next-generation platform named after the astronomer

XTI/USD Chart Analysis: WTI Oil Price Fluctuates Near $100
For the third Monday in a row, trading in the oil market has opened with a bullish gap, although this time it is not as wide as the gap seen, for example, on 9 March. The reason for the volatility