


Intel (INTC) Shares Surge Nearly 17% in Three Days
FXOpen

According to Intel Corporation’s (INTC) stock chart:
→ The price has reached its highest level in 2025.
→ Shares have surged approximately 17% in just three days—the biggest three-day gain since April 2001, when Intel rose by 24.5%, according to Dow Jones Market Data.
MarketWatch attributes the bullish sentiment to several key factors:
→ US Vice President J.D. Vance voiced support for domestic semiconductor production, stating, “To maintain America’s edge, the Trump administration will ensure the most powerful AI systems are developed in the US using American-designed and manufactured chips.”
→ Unlike many of its competitors, Intel both designs and manufactures its chips. Optimism may stem from hopes that government backing for the US semiconductor sector will benefit the company.
→ Jefferies analyst Blayne Curtis noted that Intel appears to be strengthening its position in the CPU market, driven by demand for its Emerald Rapids product.
→ Speculation surrounding potential discussions on a partnership with Taiwan Semiconductor Manufacturing Co., the world's largest chipmaker.
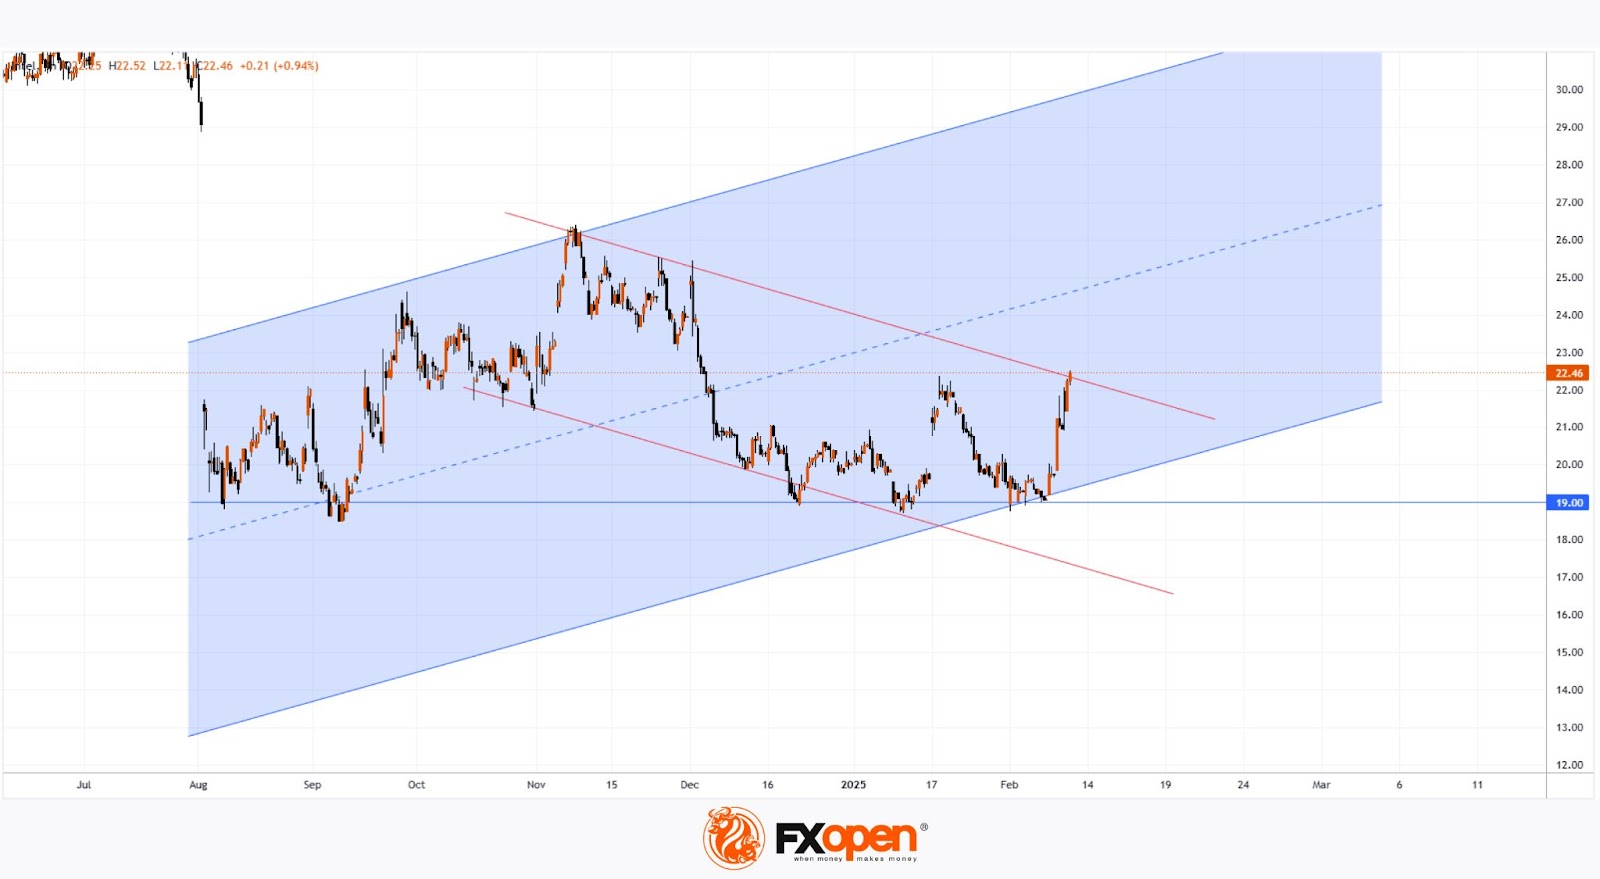
Technical Analysis of Intel (INTC) Stock
The $19 level has proven to be a strong support, as every attempt to push the price below this mark has failed.
Price fluctuations for INTC outline an ascending channel (marked in blue). While strong demand could drive the stock toward the channel median, the upper red trendline of the broader downtrend may act as resistance—raising the likelihood of a correction following the 17% surge.
Intel (INTC) Stock Forecast
Despite Intel’s stronger-than-expected Q4 earnings, analysts remain cautious.
According to TipRanks:
→ Only 1 out of 32 surveyed analysts currently recommends buying INTC stock.
→ The 12-month average price target for INTC is $22.
However, if the broader news flow continues to fuel optimism, more analysts may revise their Intel stock forecasts upward.
Buy and sell stocks of the world's biggest publicly-listed companies with CFDs on FXOpen’s trading platform. Open your FXOpen account now or learn more about trading share CFDs with FXOpen.
This article represents the opinion of the Companies operating under the FXOpen brand only. It is not to be construed as an offer, solicitation, or recommendation with respect to products and services provided by the Companies operating under the FXOpen brand, nor is it to be considered financial advice.
Stay ahead of the market!
Subscribe now to our mailing list and receive the latest market news and insights delivered directly to your inbox.


Latest articles


Market Repricing of Risk as Gold Loses Safe-Haven Demand
Geopolitical tensions in the Middle East had remained the primary macro driver for the gold market over recent weeks; however, on 8 April the situation shifted sharply as the United States and Iran agreed to a temporary two-week ceasefire, including

Commodity Currencies on the Rise: Market Focus Shifts to US and Canadian Data
Commodity-linked currencies continue to strengthen, while the US dollar remains under pressure amid easing geopolitical tensions and a shift in investor preference towards riskier assets. Reports of a temporary ceasefire between the US and Iran have helped stabilise sentiment and