


Nvidia (NVDA) Shares Surpass $200 in After-Hours Trading Following Earnings Report
FXOpen

Yesterday, the world’s most valuable company, Nvidia, released its quarterly earnings, which exceeded expectations:
→ Earnings per share: actual = $1.62 (forecast = $1.53);
→ Revenue: actual = $68.13 billion (forecast = $66.13 billion).
Sentiment was further supported by the chipmaker’s guidance for first-quarter revenue above market estimates, reflecting continued heavy spending by major technology companies on artificial intelligence processors.
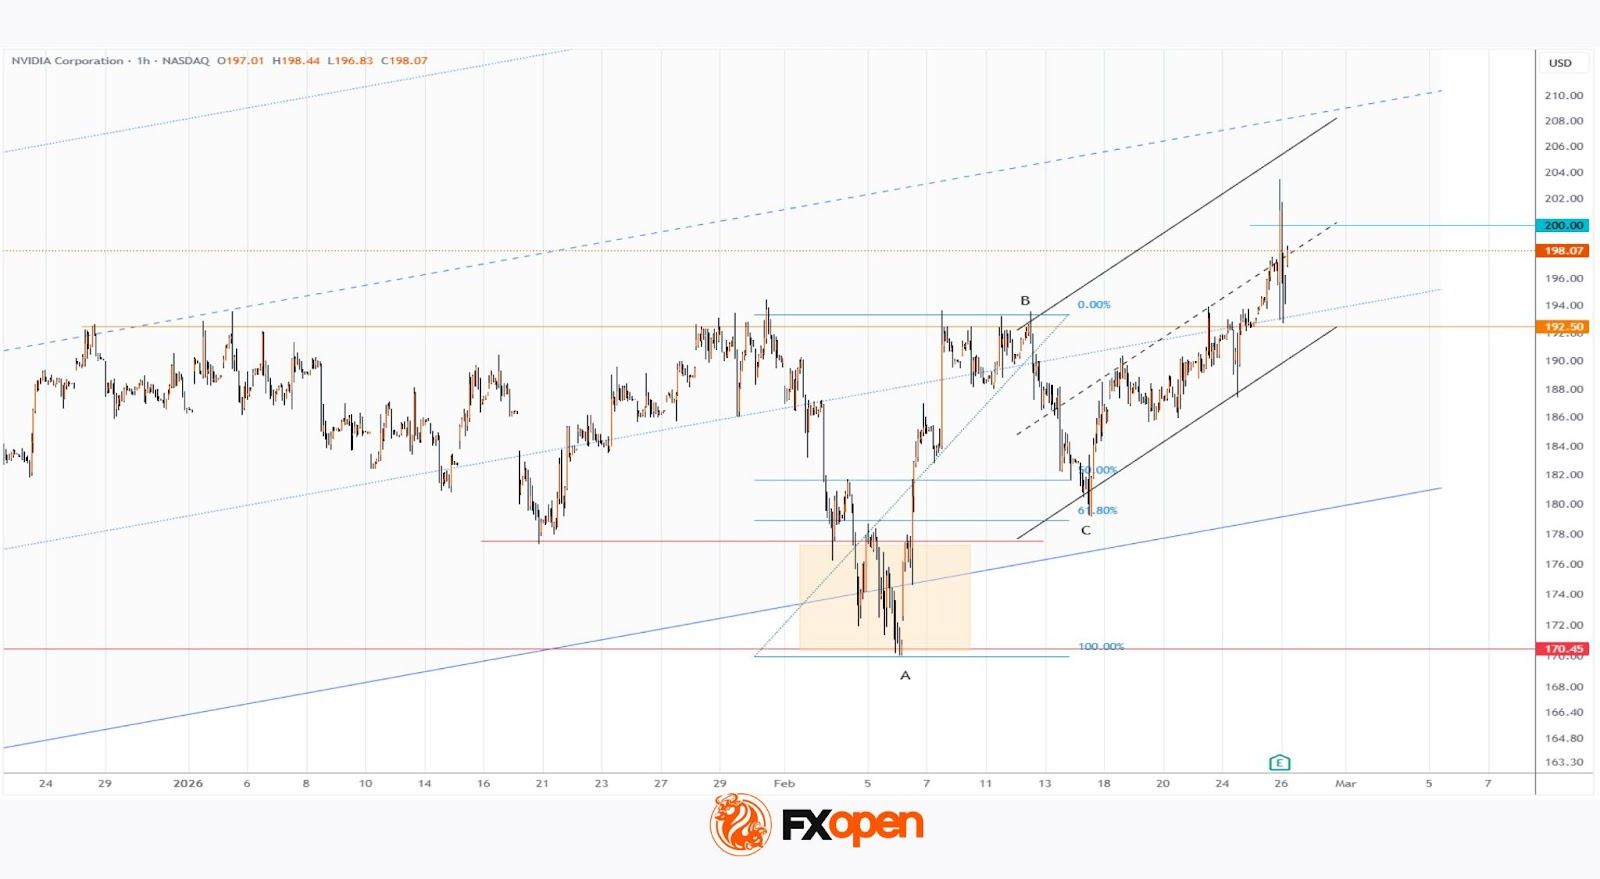
As the Nvidia (NVDA) share price chart shows, the stock rose above the psychological $200 level in after-hours trading, but subsequently pulled back, which may point to excessive optimism and aggressive selling pressure.
Technical Analysis of the Nvidia (NVDA) Chart
On 10 February, when analysing NVDA price movements, we:
→ reaffirmed the validity of the long-term ascending channel (which remains intact) and highlighted the importance of the $192.50 resistance level;
→ suggested that the initiative was on the side of the bulls, who were aiming to resume the long-term uptrend towards the psychological $200 mark.
Since then:
→ NVDA formed a pullback from the resistance level towards the 50–61.8% Fibonacci retracement zone;
→ on 17 February, it resumed its advance, supported by a short-term ascending channel (marked in black), ultimately reaching $200.
Overall, the picture appears constructive, and the next potential target for NVDA may be the median line of the long-term channel. However, it is worth recalling the recent experience of other technology giants whose shares rallied briefly after earnings before turning lower (for example, Meta). The sharp reversal from above the $200 mark lends weight to this scenario.
Therefore, if bulls are to confirm control over NVDA shares, it is important for the price to hold above the $192.50 level.
Buy and sell stocks of the world's biggest publicly-listed companies with CFDs on FXOpen’s trading platform. Open your FXOpen account now or learn more about trading share CFDs with FXOpen.
This article represents the opinion of the Companies operating under the FXOpen brand only. It is not to be construed as an offer, solicitation, or recommendation with respect to products and services provided by the Companies operating under the FXOpen brand, nor is it to be considered financial advice.
Stay ahead of the market!
Subscribe now to our mailing list and receive the latest market news and insights delivered directly to your inbox.


Latest articles

Weekly Market Insights with Gary Thomson: The Week of Central Banks and Earnings
In this video, we’ll explore the key economic events and market trends, shaping the financial landscape. Get ready for insights into financial markets to help you navigate the week ahead. Let’s dive in!
In this episode of Market

Intel at a Crossroads: Earnings Beat Meets Technical Resistance
Intel has just delivered its strongest quarter in over fifteen years, and the market reaction says it all. Q2 2026 revenue surged 25% year-over-year to $16.1 billion, crushing the consensus estimate of $14.42 billion, while adjusted EPS of

Tesla: Complex Range Structure Breaks Down Following Quarterly Earnings
Tesla released its Q2 2026 results after the market closed on 22 July. Revenue increased 26% year-on-year to $28.24 billion, while vehicle deliveries reached a record 480,126 units. However, operating margin fell sharply to 1.4%, down from