


Intel (INTC) Shares Trade Around $30
FXOpen

In August, we noted that:
→ Intel (INTC) shares gained strong bullish momentum following reports that the US government was in talks to acquire a stake in the company;
→ the INTC chart was signalling that the depressed market, in place since 2021, was undergoing a fundamental shift in sentiment, with a potential rally foundation being formed.
Last month also brought the official announcement that Japanese conglomerate SoftBank Group would invest $2 billion in Intel. September, in turn, delivered further reasons for price gains:
→ On 18 September 2025, Nvidia officially announced a $5 billion investment in Intel and the launch of a multi-year strategic partnership. This came as a shock to the market: instead of competing, the two giants decided to join forces in developing new products. INTC shares gapped strongly higher, surpassing the psychological $30 mark for the first time this year.
→ More recently, Bloomberg reported that Apple is also considering investing in Intel. Although this remains at the level of speculation (with no official confirmation from either side), INTC shares rose by more than 6% yesterday.
Technical Analysis of INTC Shares
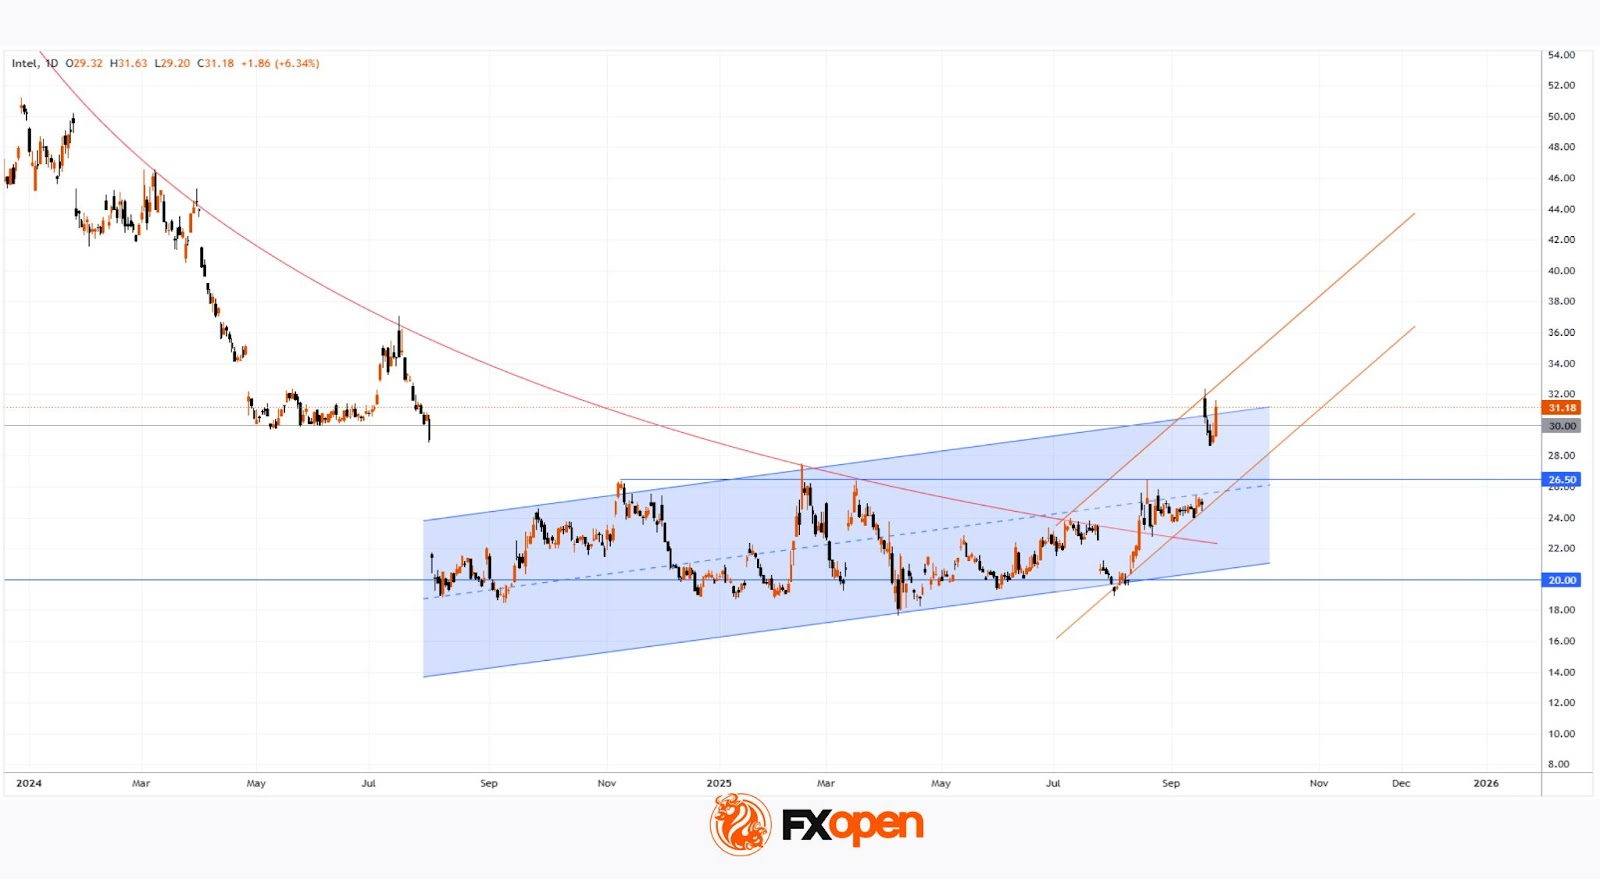
In earlier chart analysis, we highlighted the importance of the $20 level, which appeared to act as support from large players. This may have reflected confidence that the government would not allow a strategically important US company to be left behind in difficult times, particularly in the context of technological competition with China.
For many months, INTC shares had been in decline (shown by the red line). However, the price action in August–September has broken this pattern, confirming earlier assumptions. Higher lows and higher highs in 2025 have established an ascending channel (shown in blue), with key features as follows:
→ in early September, the price consolidated near the median, signalling a balance between supply and demand around $25;
→ September’s bullish news shifted the balance in favour of buyers, with INTC stock jumping towards the upper boundary of the channel.
From a bearish standpoint, potential obstacles to further growth include:
→ the psychological $30 level (which acted as support in May);
→ the upper boundary of the blue channel.
Although the market looks overbought, it is possible that:
→ buyers may refrain from taking profits in anticipation of longer-term gains;
→ and if positive rumours of further investment in Intel continue to be confirmed, this could drive an extension of the upward trend — potentially along a steeper trajectory (shown in orange).
Buy and sell stocks of the world's biggest publicly-listed companies with CFDs on FXOpen’s trading platform. Open your FXOpen account now or learn more about trading share CFDs with FXOpen.
This article represents the opinion of the Companies operating under the FXOpen brand only. It is not to be construed as an offer, solicitation, or recommendation with respect to products and services provided by the Companies operating under the FXOpen brand, nor is it to be considered financial advice.
Stay ahead of the market!
Subscribe now to our mailing list and receive the latest market news and insights delivered directly to your inbox.


Latest articles


Market Repricing of Risk as Gold Loses Safe-Haven Demand
Geopolitical tensions in the Middle East had remained the primary macro driver for the gold market over recent weeks; however, on 8 April the situation shifted sharply as the United States and Iran agreed to a temporary two-week ceasefire, including

Commodity Currencies on the Rise: Market Focus Shifts to US and Canadian Data
Commodity-linked currencies continue to strengthen, while the US dollar remains under pressure amid easing geopolitical tensions and a shift in investor preference towards riskier assets. Reports of a temporary ceasefire between the US and Iran have helped stabilise sentiment and