FXOpen

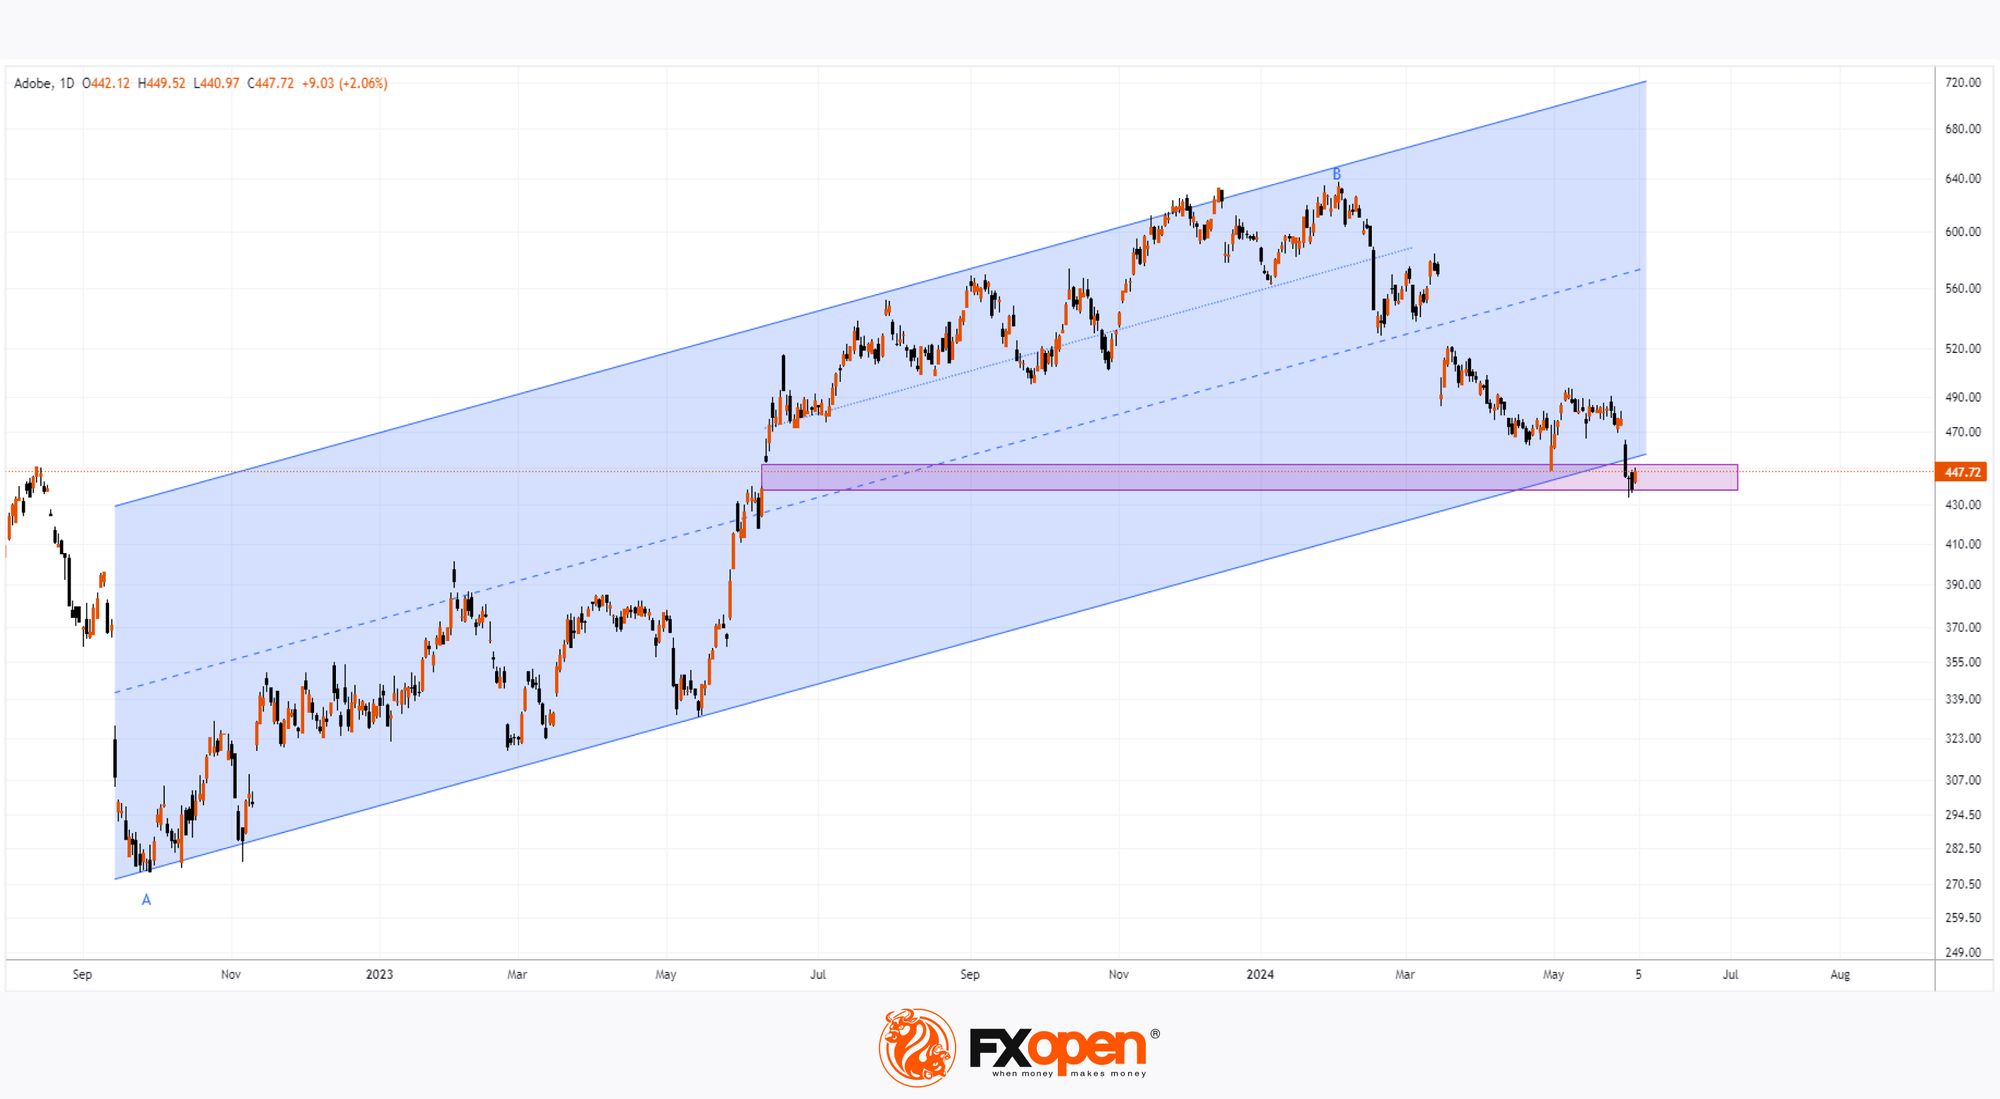
The stock chart for Adobe Systems shows that on May 31, 2024, the price fell below $440 – for the first time since June 2023. This drop was partly due to increased competition from Canva, which released updated tools.
However, in early June, the decline did not continue, suggesting that ADBE stock is consolidating around a multi-month low.
Since the beginning of the year, ADBE has decreased by approximately 23%, while the NASDAQ index (US Tech 100 mini on FXOpen) has increased by more than 12%. Is this indicative of serious problems for the company or is the stock undervalued?
A significant amount of information will come from Adobe Systems' earnings report, which will be released on June 13, 2024. According to Yahoo Finance.
- The company's earnings per share are forecasted to be $4.38, representing a 12.02% increase compared to the same quarter last year.
- Revenue is forecasted at $5.28 billion, a 9.65% increase compared to the same quarter last year.
It is noteworthy that since December 2018, Adobe has consistently exceeded expectations (though this has not always led to a rise in the stock price).
According to TipRanks, the average price target for ADBE stock is $624.83 over the next 12 months, indicating a potential upside of +39.36% from current levels – suggesting that most analysts do not believe the company has deep internal issues, as otherwise they would not be forecasting such price growth.

Technical analysis of ADBE’s daily chart shows that the price action is forming an uptrend (indicated in blue). The price is near the lower boundary of this trend, and:
→ The current price is near the 50% retracement level of the A→B growth wave;
→ The current price has closed last year’s bullish gap.
Therefore, the release of the earnings report on June 13 could be a catalyst that helps bulls resume the uptrend and push the price towards the levels indicated by analysts.
Buy and sell stocks of the world's biggest publicly-listed companies with CFDs on FXOpen’s trading platform. Open your FXOpen account now or learn more about trading share CFDs with FXOpen.
This article represents the opinion of the Companies operating under the FXOpen brand only. It is not to be construed as an offer, solicitation, or recommendation with respect to products and services provided by the Companies operating under the FXOpen brand, nor is it to be considered financial advice.
Stay ahead of the market!
Subscribe now to our mailing list and receive the latest market news and insights delivered directly to your inbox.


