


FXOpen

On Friday, before the market opened, JPMorgan (JPM) released its Q3 earnings, which exceeded expectations:
→ Earnings per share: Expected = $3.99, Actual = $4.97
→ Revenue: Expected = $41.4 billion, Actual = $43.4 billion
CEO Jamie Dimon praised the strong results but issued several cautionary statements. He noted:
→ Geopolitical risks are rising rapidly. "We have been closely monitoring the geopolitical situation for some time, and recent events show that conditions are dangerous and deteriorating."
→ "While inflation is easing and the US economy remains resilient, several critical challenges persist, including a large budget deficit, infrastructure needs, trade restructuring, and the remilitarisation of the world."
Despite Dimon's caution, investors responded positively to JPMorgan’s strong results, pushing JPM shares up more than 4% on Friday.
Year-to-date, the stock has gained around 30%, and since last October, the increase has been about 50%.
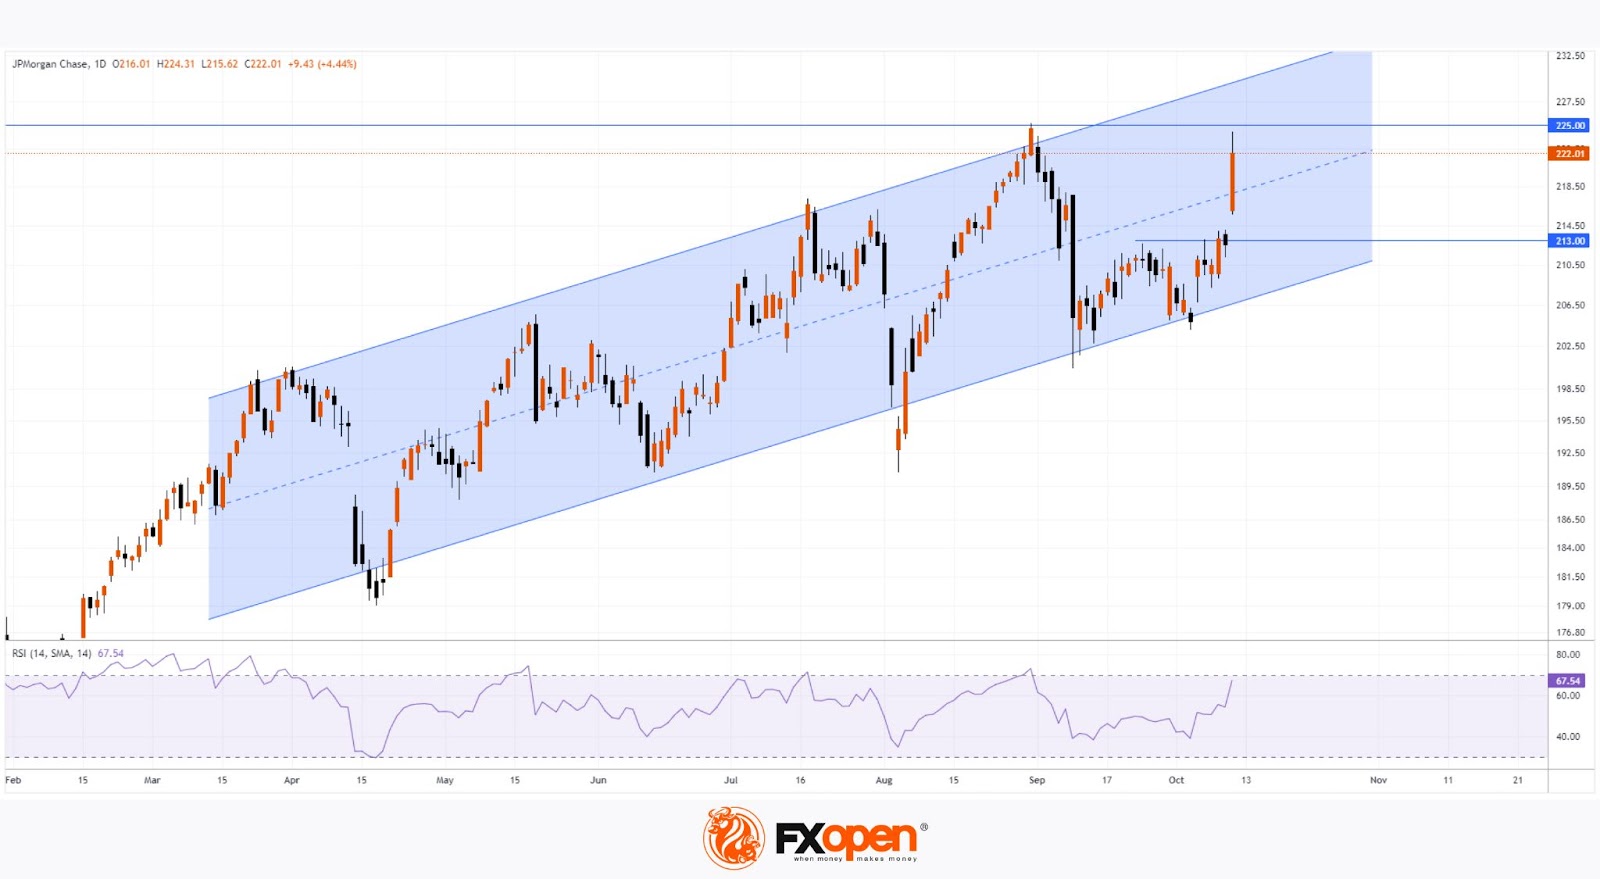
Technical Analysis of JPMorgan (JPM) Shares:
→ The price is moving within an ascending channel (shown in blue).
→ The RSI indicator has risen to the overbought zone.
→ Friday’s candlestick shows a noticeable upper shadow (a sign of selling pressure).
→ The psychological level of $225 per share may act as resistance, as seen at the start of September.
If the bullish momentum continues and the price of JPM shares approaches the upper boundary of the channel, this could set the stage for a correction, potentially towards the support zone formed by:
→ The lower boundary of the blue channel
→ Former resistance at $213
→ The lower edge of Friday’s bullish gap
According to TipRanks, the average analyst price target for JPMorgan shares is $228 over the next 12 months.
Buy and sell stocks of the world's biggest publicly-listed companies with CFDs on FXOpen’s trading platform. Open your FXOpen account now or learn more about trading share CFDs with FXOpen.
This article represents the opinion of the Companies operating under the FXOpen brand only. It is not to be construed as an offer, solicitation, or recommendation with respect to products and services provided by the Companies operating under the FXOpen brand, nor is it to be considered financial advice.
Stay ahead of the market!
Subscribe now to our mailing list and receive the latest market news and insights delivered directly to your inbox.


Latest articles

Market Analysis: GBP/USD Dips Further As EUR/GBP Regains Traction
GBP/USD failed to climb above 1.3500 and corrected some gains. EUR/GBP started a decent increase and might aim for more gains above 0.8700.
Important Takeaways for GBP/USD and EUR/GBP Analysis Today
· The British Pound


Market Insights with Gary Thomson: Oil, US Retail Sales & NFP in Focus
In this video, we’ll explore the key economic events and market trends, shaping the financial landscape. Get ready for insights into financial markets to help you navigate the week ahead. Let’s dive in!
In this episode of Market