


FXOpen

AAPL shares rose approximately 1.2% during the session yesterday in anticipation of a strong Q3 report. It actually turned out better than predicted:
→ earnings per share: actual = USD 1.46; forecast = USD 1.39;
→ gross income: actual = USD 89.49 billion; forecast = USD 89.34 billion.
However, as a result, the price of AAPL shares decreased; in the pre-market on Friday, the share price was about USD 171.50, although yesterday it closed at USD 177.78 according to the NASDAQ exchange (minus 3.50%).
The reason is the company's disappointing plans for the future.
Tim Cook refused to answer a question about Apple's investments in AI. And Apple Chief Financial Officer Luca Maestri failed to reassure investors that there would be a surge in sales over the holiday period, saying gross revenue would be similar to what it was a year ago. So analysts can expect the company to continue to show a decline in sales, which already looks like a trend for 2023.
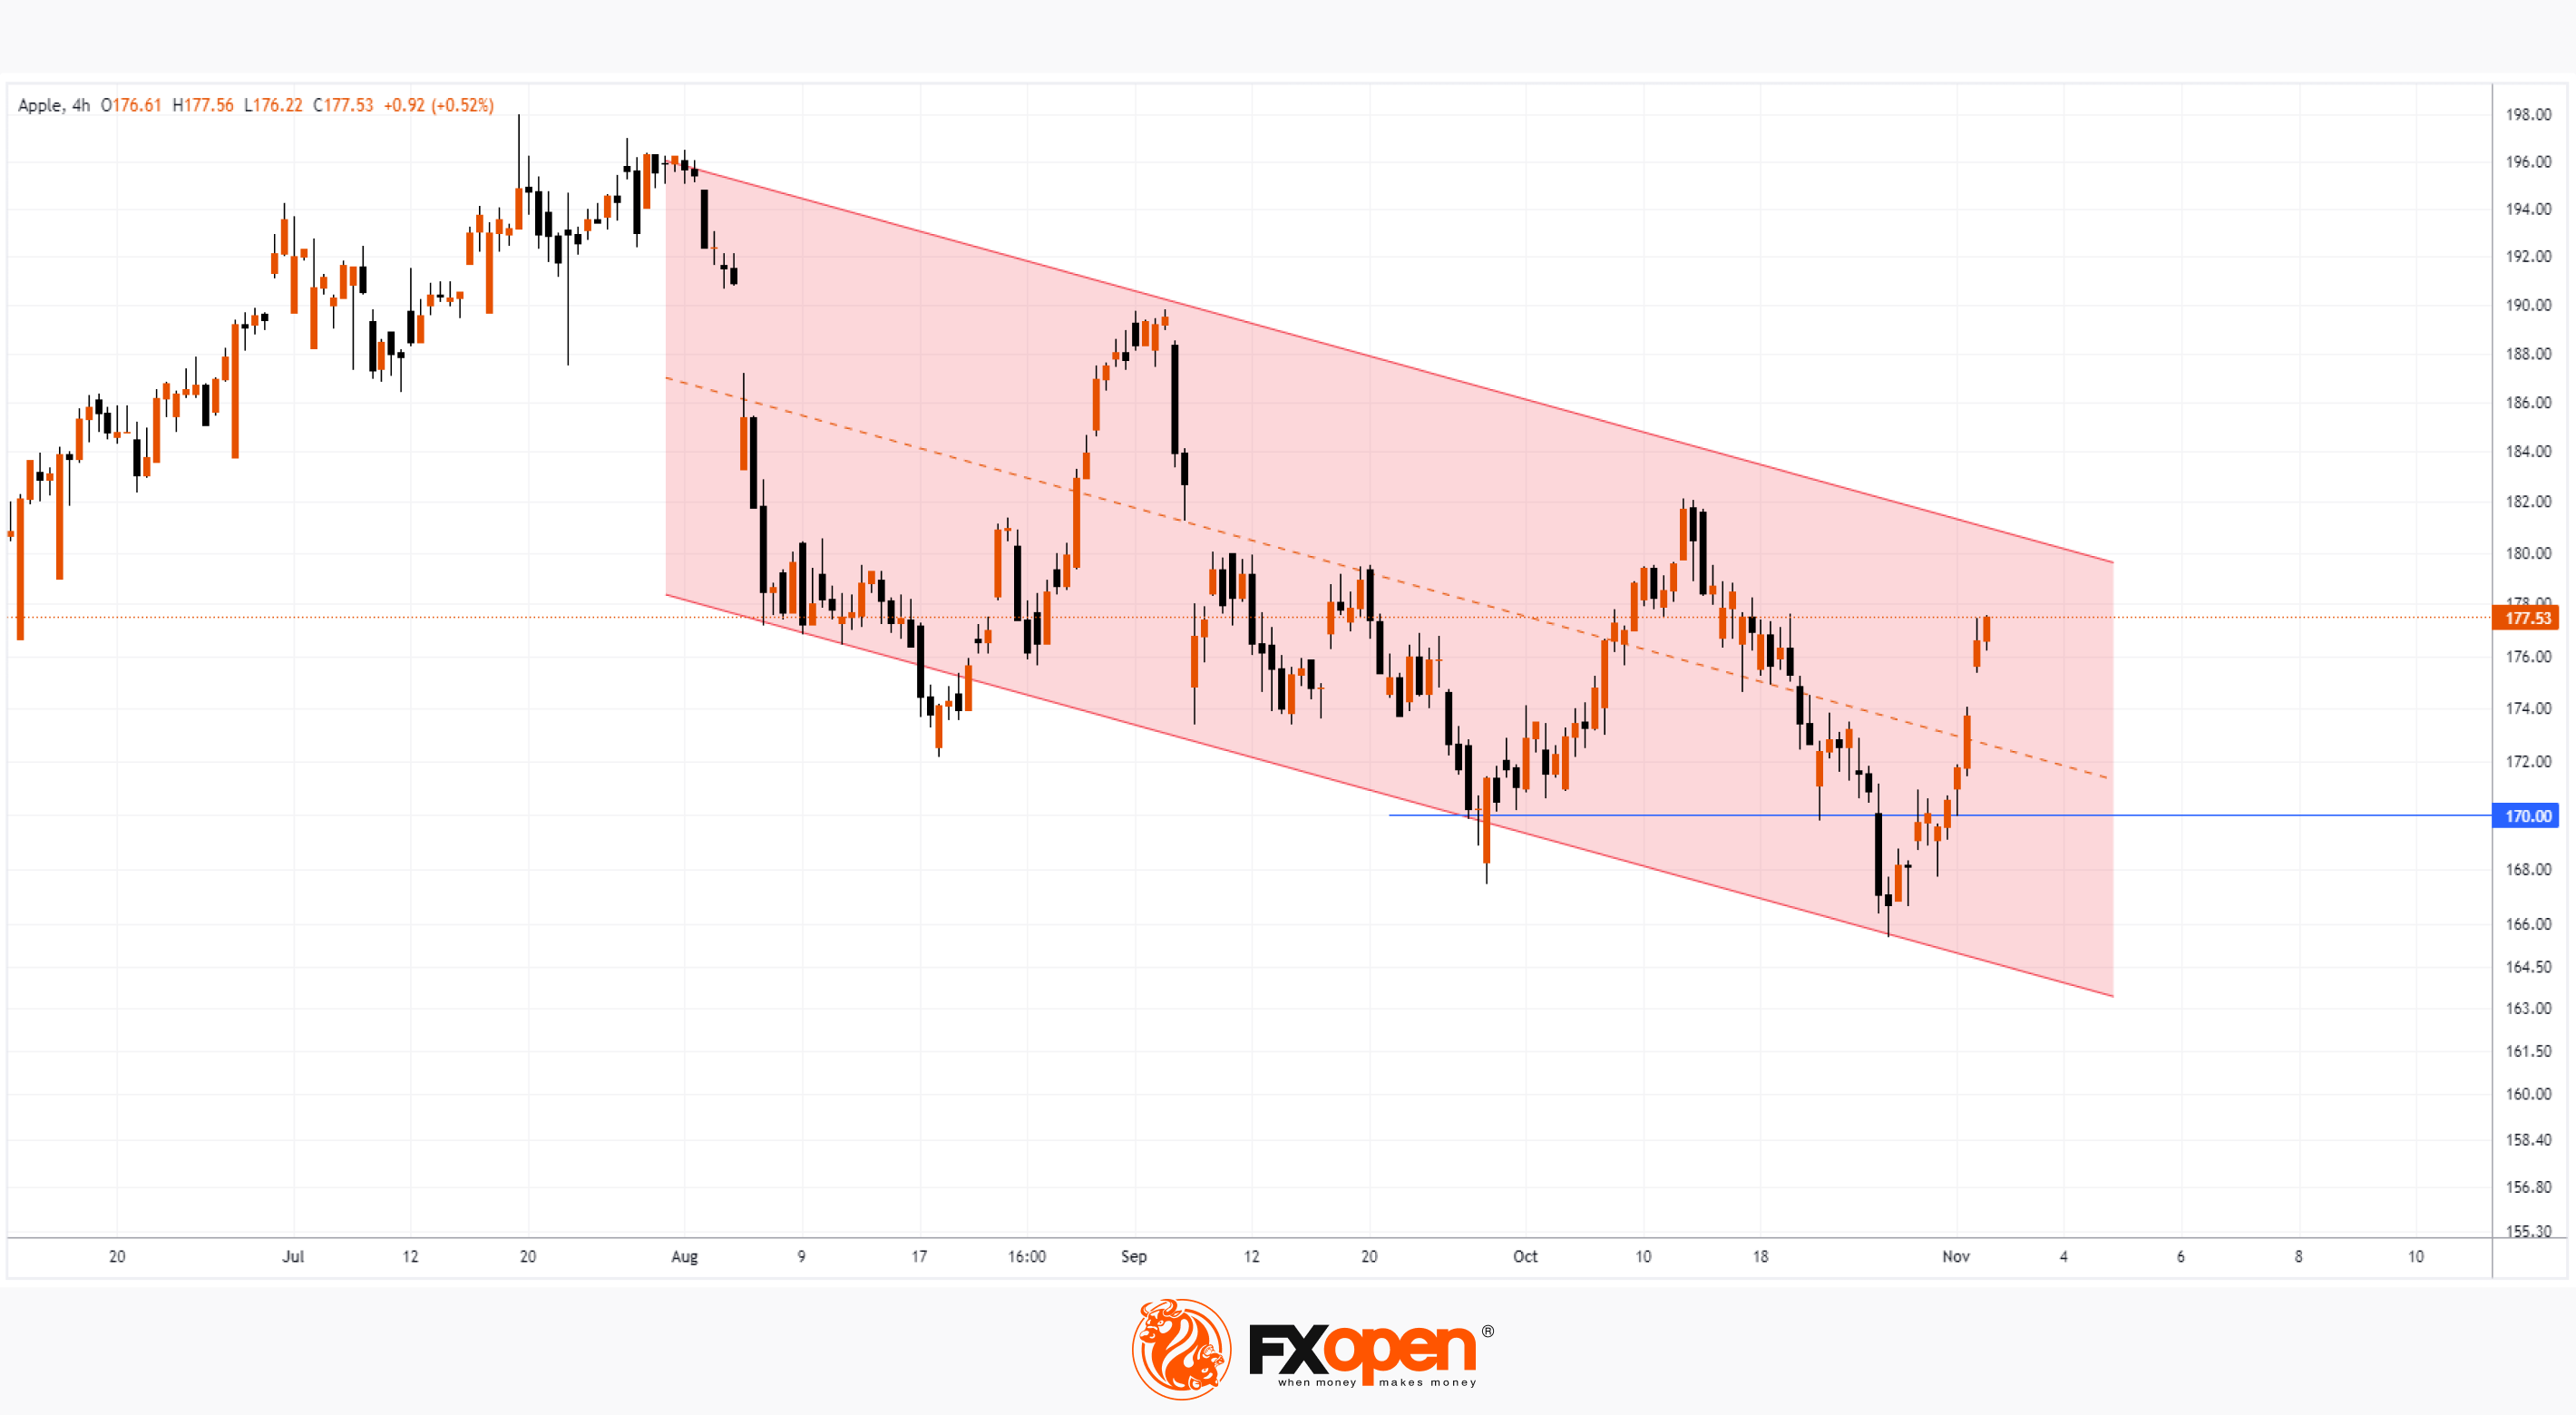
AAPL stock price performance shows that the stock market is largely a reflection of hopes, emotions and belief in rumors. In fact:
→ the price continues to move in a downward trend (shown by the blue channel);
→ growth to its upper limit in the hope of a positive report turned into a collapse;
→ the opening of trading today may take place at the bottom of the channel;
→ bears may attack the psychological level of USD 170 per share today. This level is also important because it is approximately 50% of the price increase from the March lows to the highs of the year.
If the USD 170 level is broken by the bears with the extension of the candle body and increased volumes, it could become an important resistance further down the line. So close to losing the status of the most valuable company.
Buy and sell stocks of the world's biggest publicly-listed companies with CFDs on FXOpen’s trading platform. Open your FXOpen account now or learn more about trading share CFDs with FXOpen.
This article represents the opinion of the Companies operating under the FXOpen brand only. It is not to be construed as an offer, solicitation, or recommendation with respect to products and services provided by the Companies operating under the FXOpen brand, nor is it to be considered financial advice.
Stay ahead of the market!
Subscribe now to our mailing list and receive the latest market news and insights delivered directly to your inbox.


Latest articles

Consolidation Ahead of NFP: Commodity Currencies Search for Direction
Commodity-linked currencies have entered a consolidation phase following recent directional moves, as market participants adopt a wait-and-see approach ahead of key US labour market data. Current price action reflects a balance between ongoing demand for the US dollar and attempts

The Real Driver Behind the Dollar Rally: Market Insights with Gary Thomson
The US dollar has been firm, but the drivers behind the move may be more complex than they first appear.
While geopolitical tension and shifts in risk sentiment play a role, current price behaviour seems increasingly influenced by inflation expectations

EUR/USD and USD/CHF Pull Back: Market Reacts to Fundamentals
European currencies have shown a recovery in recent trading sessions after their recent decline, displaying early signs of a reversal. The US dollar is weakening amid expectations surrounding upcoming US macroeconomic data, while market participants are reassessing their short-term positions