


Market Analysis: AMD Share Price Breaks August 2022 High
FXOpen

It happened last week. Since the beginning of 2023, AMD's share price has risen by 66%. According to technical analysts at Bank of America, AMD's share price has a bullish outlook; interestingly, just 2 weeks ago, the bank downgraded the stock.
According to analysts polled by the WSJ, AMD's average target price for a share is USD 102.68, which is below current levels.
How can the price of Advanced Micro Devices stock change?
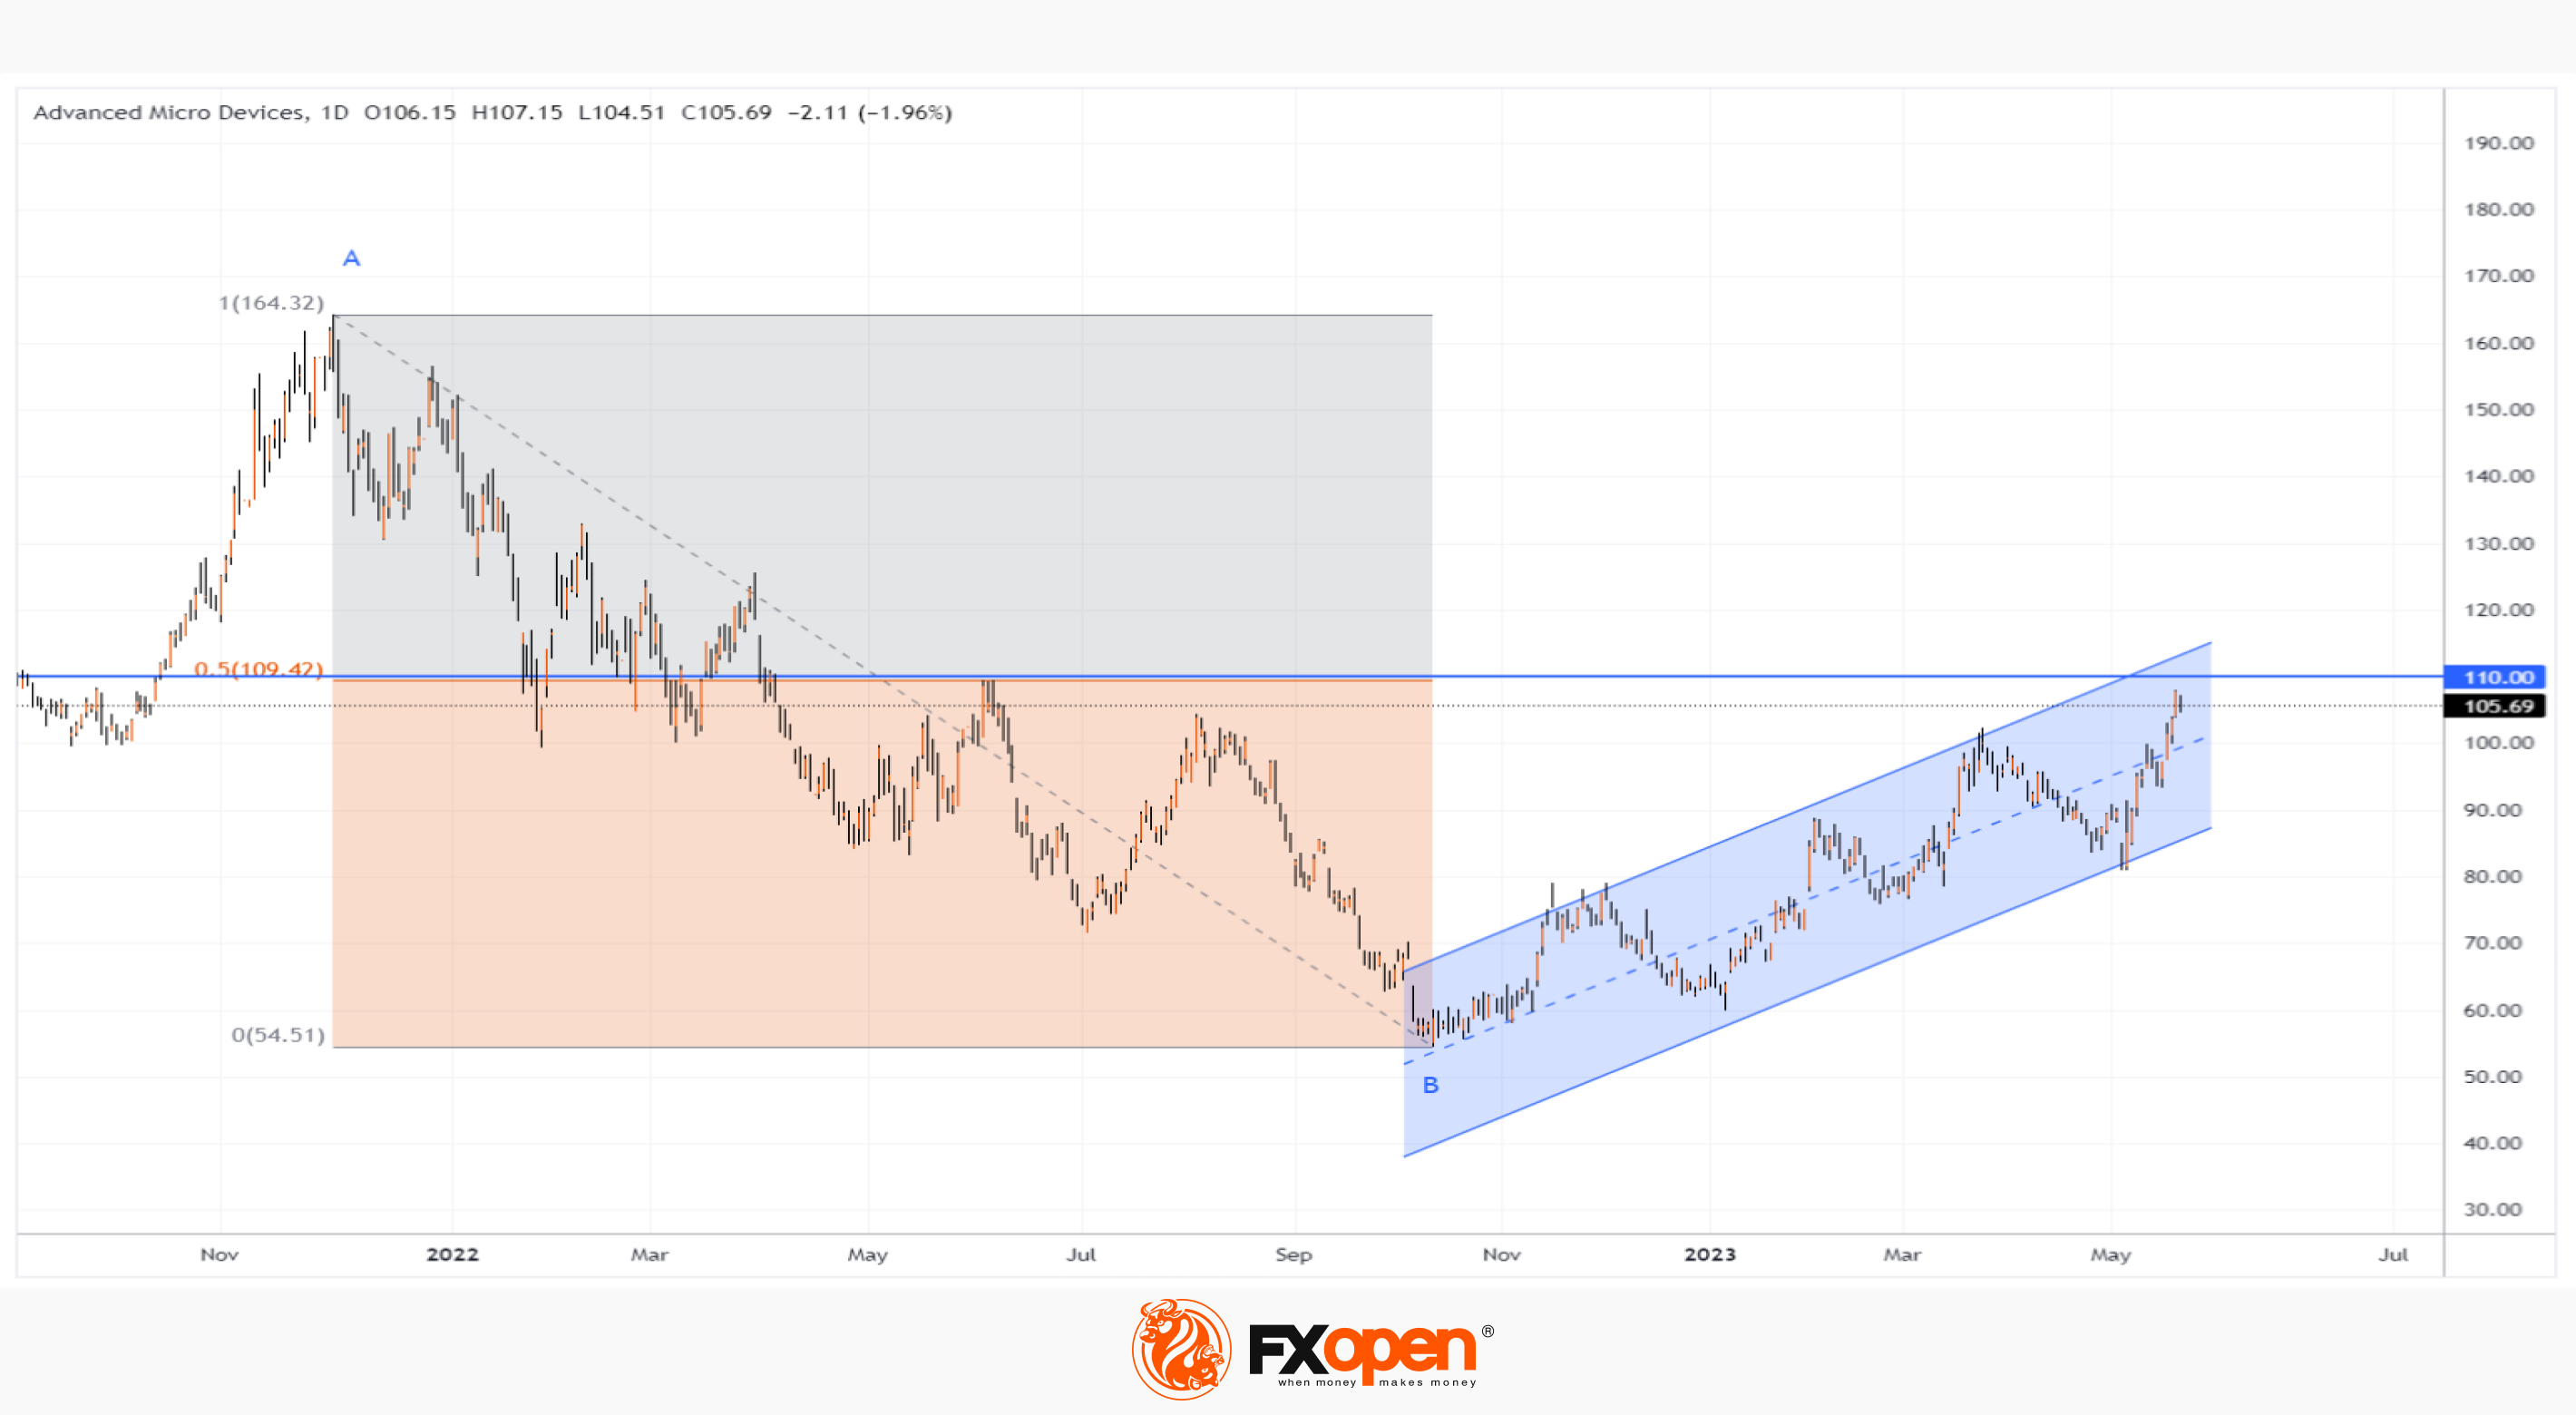
From the point of view of technical analysis of AMD shares, the following barriers to continued growth can occur:
→ the level of 109.42, which is 50% of the decline in A→B;
→ the psychological level of USD 110;
→ the upper line of the ascending channel (shown in blue).
It is also worth noting the unfavorable fundamental background, where the news about raising the US national debt ceiling comes to the fore. ECB President Christine Lagarde on Sunday appealed to US politicians to resolve the conflict. And Treasury Secretary Janet Yellen told NBC that the US is unlikely to survive until mid-June still able to pay its bills.
Therefore, if the AMD stock chart pulls back — for instance, to the lower border of the blue ascending channel — this should not come as a surprise.
Buy and sell stocks of the world's biggest publicly-listed companies with CFDs on FXOpen’s trading platform. Open your FXOpen account now or learn more about trading share CFDs with FXOpen.
This article represents the opinion of the Companies operating under the FXOpen brand only. It is not to be construed as an offer, solicitation, or recommendation with respect to products and services provided by the Companies operating under the FXOpen brand, nor is it to be considered financial advice.
Stay ahead of the market!
Subscribe now to our mailing list and receive the latest market news and insights delivered directly to your inbox.


Latest articles

USD/JPY and USD/CHF Near Key Levels: The Dollar Supported by the Fed
The US dollar continues to trend upwards following the Federal Reserve meeting, drawing support from the regulator’s moderately hawkish stance and comments by Jerome Powell. Markets interpret the Fed’s rhetoric as a signal that restrictive policy is likely

EUR/USD and GBP/USD consolidate ahead of the Fed decision
European currencies are showing subdued dynamics, entering a consolidation phase following their previous advance. Earlier, EUR/USD and GBP/USD broke out of their ranges and strengthened; however, the subsequent correction has led both pairs to retest the previously breached

Meta: V-Shaped Recovery Meets Heavy Volume Resistance
The movement in Meta Platforms shares is being driven by two competing narratives. On one hand, advertising revenue is benefiting from AI-based tools: the Advantage+ platform continues to support strong advertiser demand, and the analyst consensus for Q1 2026 revenue