


Market Analysis: AMD Share Price on the Rise After Financial Statement Release
FXOpen

Positivity:
- Advanced Micro Devices EPS of USD 58 cents (Wall Street Consensus = 57 cents);
- Q2 revenue of USD 5.36 billion (Analysts expectation = USD 5.3 billion).
Negativity:
- revenue from data centers decreased by 11% compared to the same period last year;
- PC revenue fell 54% year-over-year: the pandemic is fading.
Particular attention of investors was attracted by the words of CEO Lisa Su regarding AI. According to her, by 2027 the market for artificial intelligence processors in data centers will exceed USD 150 billion. She also noted that in Q2, the company's AI business grew 7 times.
AMD's share price jumped up +3% after the report, which was published after the end of the main trading session. At the same time, the AMD stock chart shows mixed signals.
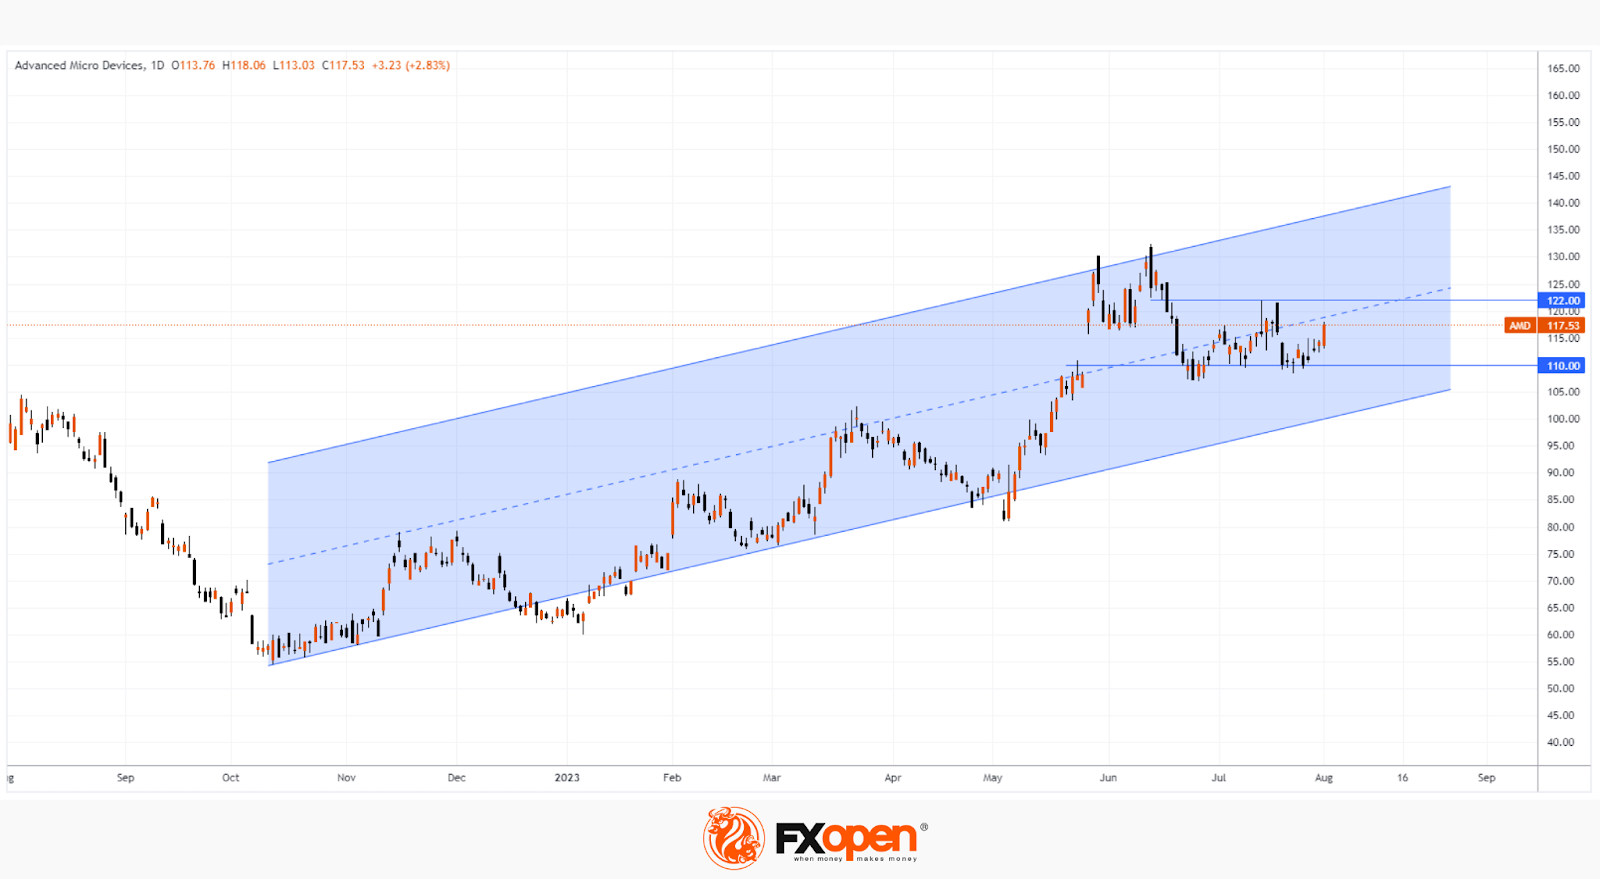
Bullish technical analysis arguments for AMD stock:
- AMD share price continues to rise within the rising channel in 2023, acting significantly stronger than the S&P 500 stock market index;
- AMD's USD 110 support level, originating from the May bullish gap, has confirmed its strength.
Bearish arguments:
- After a jump related to reporting, the price decreases in the premarket. A long upper shadow is a sign that the first positive emotional reaction could be wrong;
- AMD's share price is experiencing resistance near the USD 122 level, which originates from the low of the bear bar on June 13 (the day the NASDAQ exchange recorded the largest trading volumes for the spring-summer, which indicates selling pressure).
According to MarketWatch, the average target price for AMD shares is USD 137.50 — analysts are positive about the prospects, seeing the renewal of the historical maximum.
Buy and sell stocks of the world's biggest publicly-listed companies with CFDs on FXOpen’s trading platform. Open your FXOpen account now or learn more about trading share CFDs with FXOpen.
This article represents the opinion of the Companies operating under the FXOpen brand only. It is not to be construed as an offer, solicitation, or recommendation with respect to products and services provided by the Companies operating under the FXOpen brand, nor is it to be considered financial advice.
Stay ahead of the market!
Subscribe now to our mailing list and receive the latest market news and insights delivered directly to your inbox.


Latest articles

DAX 40: consolidation amid technology sell-off
A wave of selling in the technology sector that emerged earlier this week has weighed on European equities. The trigger was investor concern over the profitability of large-scale debt-funded investments by major US tech companies in AI infrastructure. The Nasdaq

Euro Hits Fresh Yearly Lows Amid Dovish ECB Signals
The euro remains under pressure following weak macroeconomic data from the euro area and fresh signals that the European Central Bank is prepared to maintain a more accommodative monetary policy stance. Data released yesterday pointed to a deterioration in business

Pound at Key Levels: Markets Assess Impact of Political Uncertainty in the UK
The British pound remains under pressure following increased political uncertainty in the United Kingdom triggered by the Prime Minister’s resignation. Investors are assessing potential shifts in the political and economic policy outlook after the head of government stepped down,