


FXOpen

Warren Buffett's holdings posted record operating profits last week, pushing Berkshire Hathaway's asset value to over USD 1 trillion for the first time.
→ Operating income rose 6.65% in the second quarter to USD 10.04 billion, the company's all-time high from USD 9.42 billion in the same period last year.
→ BRK's earnings per share were USD 4.6 (expected USD 3.7).
However, a bearish engulfing pattern has formed on the BRK stock chart near the all-time high of USD 362.1 set in March 2022. The share price fell overall with the US stock market under pressure, including from the rating downgrade by Fitch. At the same time, BRK's share price is stronger than E-mini S&P 500 futures, which are down more than 2% from their August high.
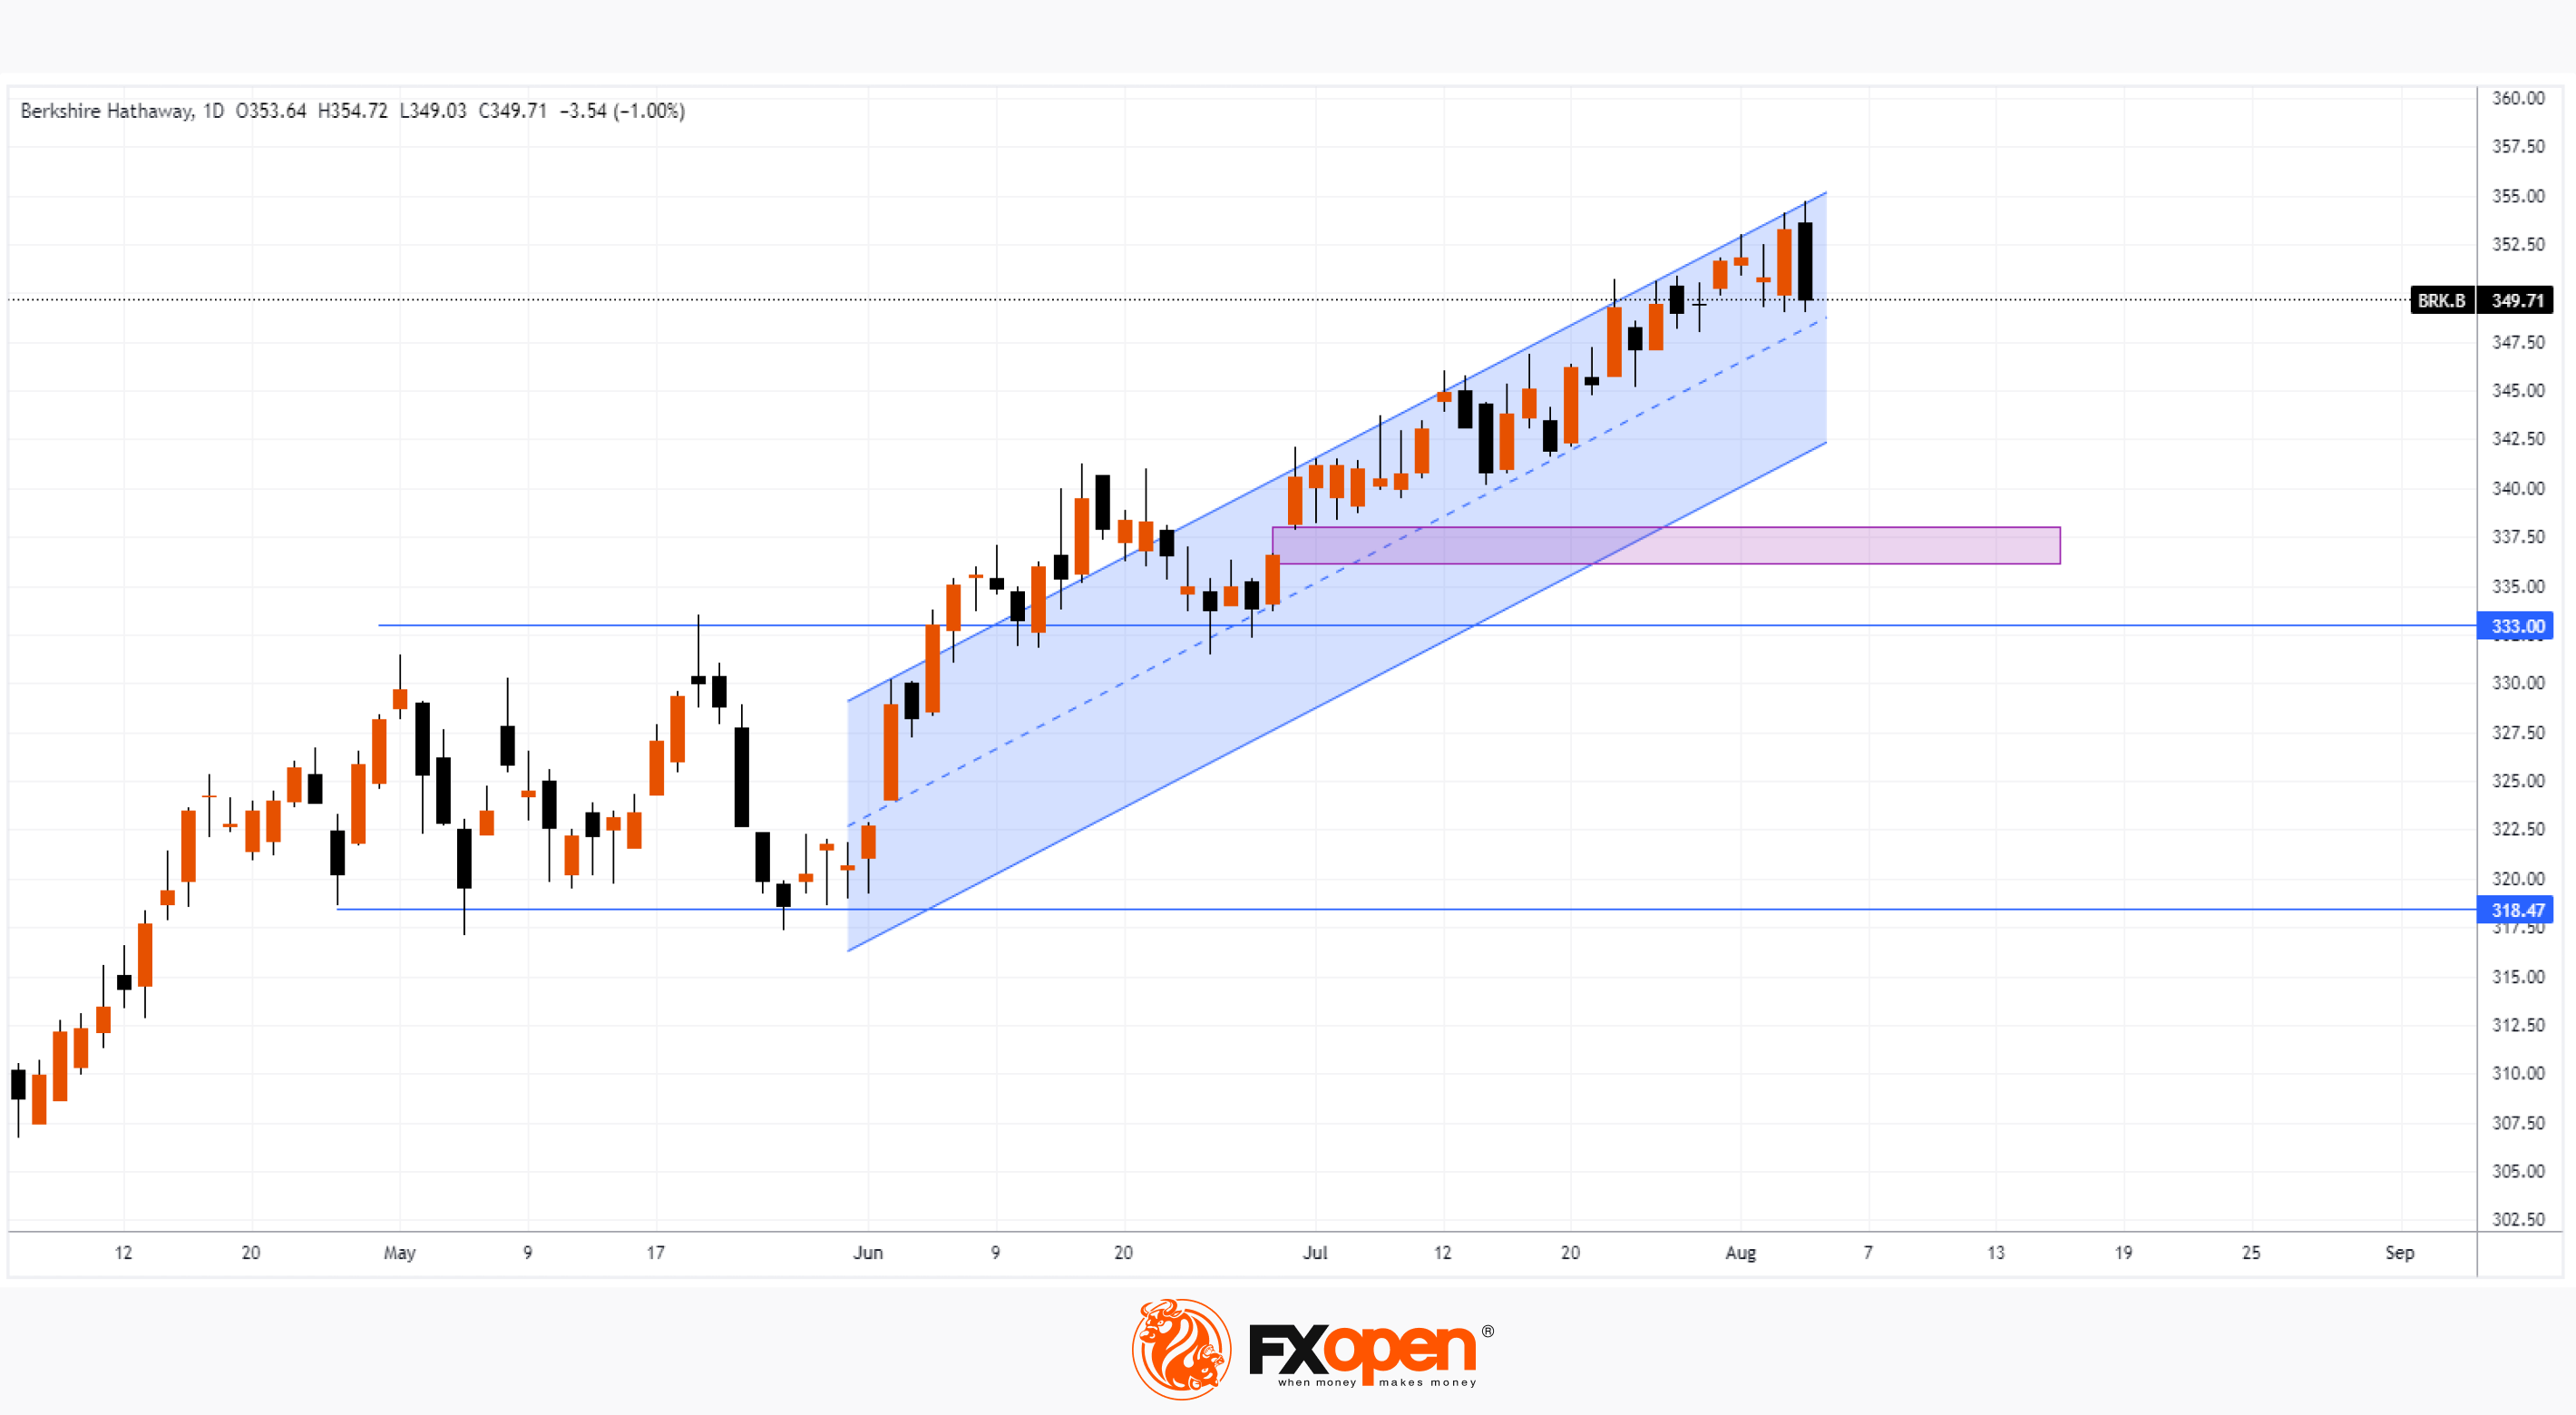
Technical analysis of the BRK chart suggests that Berkshire Hathaway's share price may be affected by:
→ support from the lower border of the ascending channel (shown in blue);
→ support from the USD 333 level, which served as resistance for the May range;
→ a bullish gap zone around USD 337, where, by the way, the 50% level of growth from the lows of the May range to the high of the year passes.
Analysts polled by MarketWatch have a median target price of USD 384.26 for BRK (about +10% from current levels).
Buy and sell stocks of the world's biggest publicly-listed companies with CFDs on FXOpen’s trading platform. Open your FXOpen account now or learn more about trading share CFDs with FXOpen.
This article represents the opinion of the Companies operating under the FXOpen brand only. It is not to be construed as an offer, solicitation, or recommendation with respect to products and services provided by the Companies operating under the FXOpen brand, nor is it to be considered financial advice.
Stay ahead of the market!
Subscribe now to our mailing list and receive the latest market news and insights delivered directly to your inbox.


Latest articles

Silver Price Breaks February Resistance Line
As seen on the XAG/USD chart, silver has today breached the upper boundary of the descending channel formed by February’s lower highs and lows.
Bullish sentiment is supported by heightened geopolitical tensions and rising demand for safe-haven assets.

BTC/USD Analysis: Are the Bulls Stirring?
According to media reports, Bitcoin’s fall from its all-time high in October 2025 to February’s low near $60k triggered the largest outflow from spot Bitcoin ETF funds since their launch in January 2024.
Glassnode data show that more

Nvidia Stock Price Targets for 2026-2030: What Analysts Think
Nvidia (NVDA) is one of