


FXOpen

The graph of popular stock indices shows that since the beginning of the year, the Nasdaq index has managed to achieve the best result (almost + 40%), while the FTSE shows itself worse than others (about 0%). What are the reasons behind that?
The Nasdaq (NDX 100) is bullish because the index:
→ comprises tech stocks that are rapidly rising in value amid the AI-related hype. Businesswire writes that the AI industry will grow by +40% every year until 2026;
→ is less affected by concerns about bank failures in spring 2023.
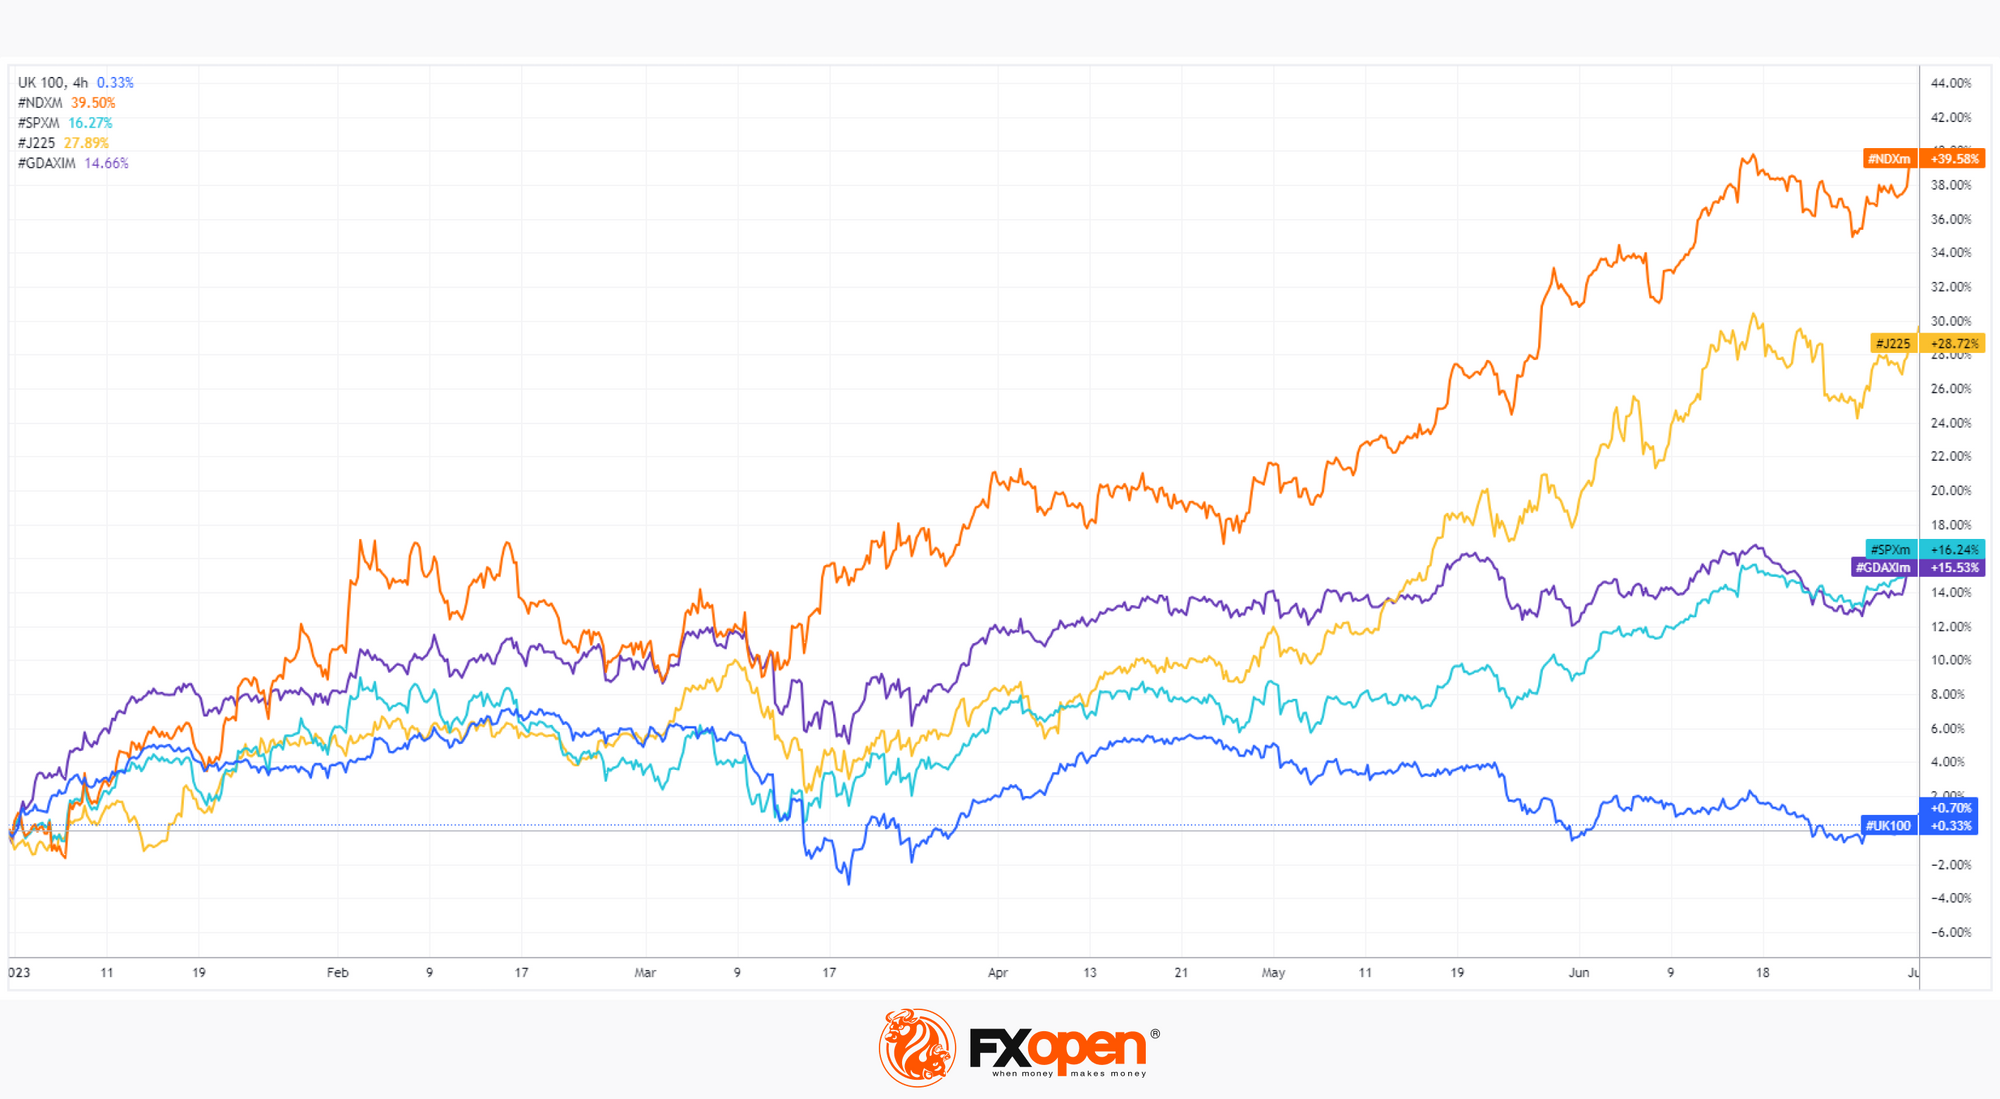
The FTSE (aka UK100) is bearish because technology companies that can benefit from AI development are not heavily weighted in the index, but commodity companies are relatively heavily weighted, and the price of oil has decreased by about 13% since the beginning of the year. High inflation rates in the UK also add to the negative. The FT writes about doubts that the Bank of England will be able to curb it.
It is likely that inflation, high central bank rates (which lead to bank failures) and the boom associated with AI will continue to be relevant topics to some extent in the second half of 2023.
Trade global index CFDs with zero commission and tight spreads. Open your FXOpen account now or learn more about trading index CFDs with FXOpen.
This article represents the opinion of the Companies operating under the FXOpen brand only. It is not to be construed as an offer, solicitation, or recommendation with respect to products and services provided by the Companies operating under the FXOpen brand, nor is it to be considered financial advice.
Stay ahead of the market!
Subscribe now to our mailing list and receive the latest market news and insights delivered directly to your inbox.


Latest articles

XBR/USD Chart Analysis: Price Rebounds from a Seven-Week Low
On 1 December, we outlined a descending channel on the XBR/USD chart and noted that the bearish trend was driven by fading geopolitical risks. Indeed, hopes for an end to the war in Ukraine—along with the possibility of

Silver Price Hits Historic Record Around $64
On 27 November, we suggested that silver was preparing to challenge its all-time high. Since then (marked with the orange arrow), XAG/USD has risen by roughly 18%, breaking above the psychological $60-per-ounce threshold for the first time in history.