


Market Analysis: In Forex, GBP/USD Reaches a New High Since the Beginning of the Year
FXOpen

Today, the British pound has updated its maximum since the beginning of the year. Here are the factors that contributed to this:
→ weakness of the US dollar due to the threat of default. The FT relays Yellen's words that the US Treasury Department's ability to bypass the default is running out;
→ the US dollar's weakness due to the banking crisis. According to media reports, 722 US banks have unrealized losses of more than 50% of capital;
→ the upcoming meeting of the Bank of England (Thursday, at 14:00 GMT+3). A rate increase is expected, which may not be the last.
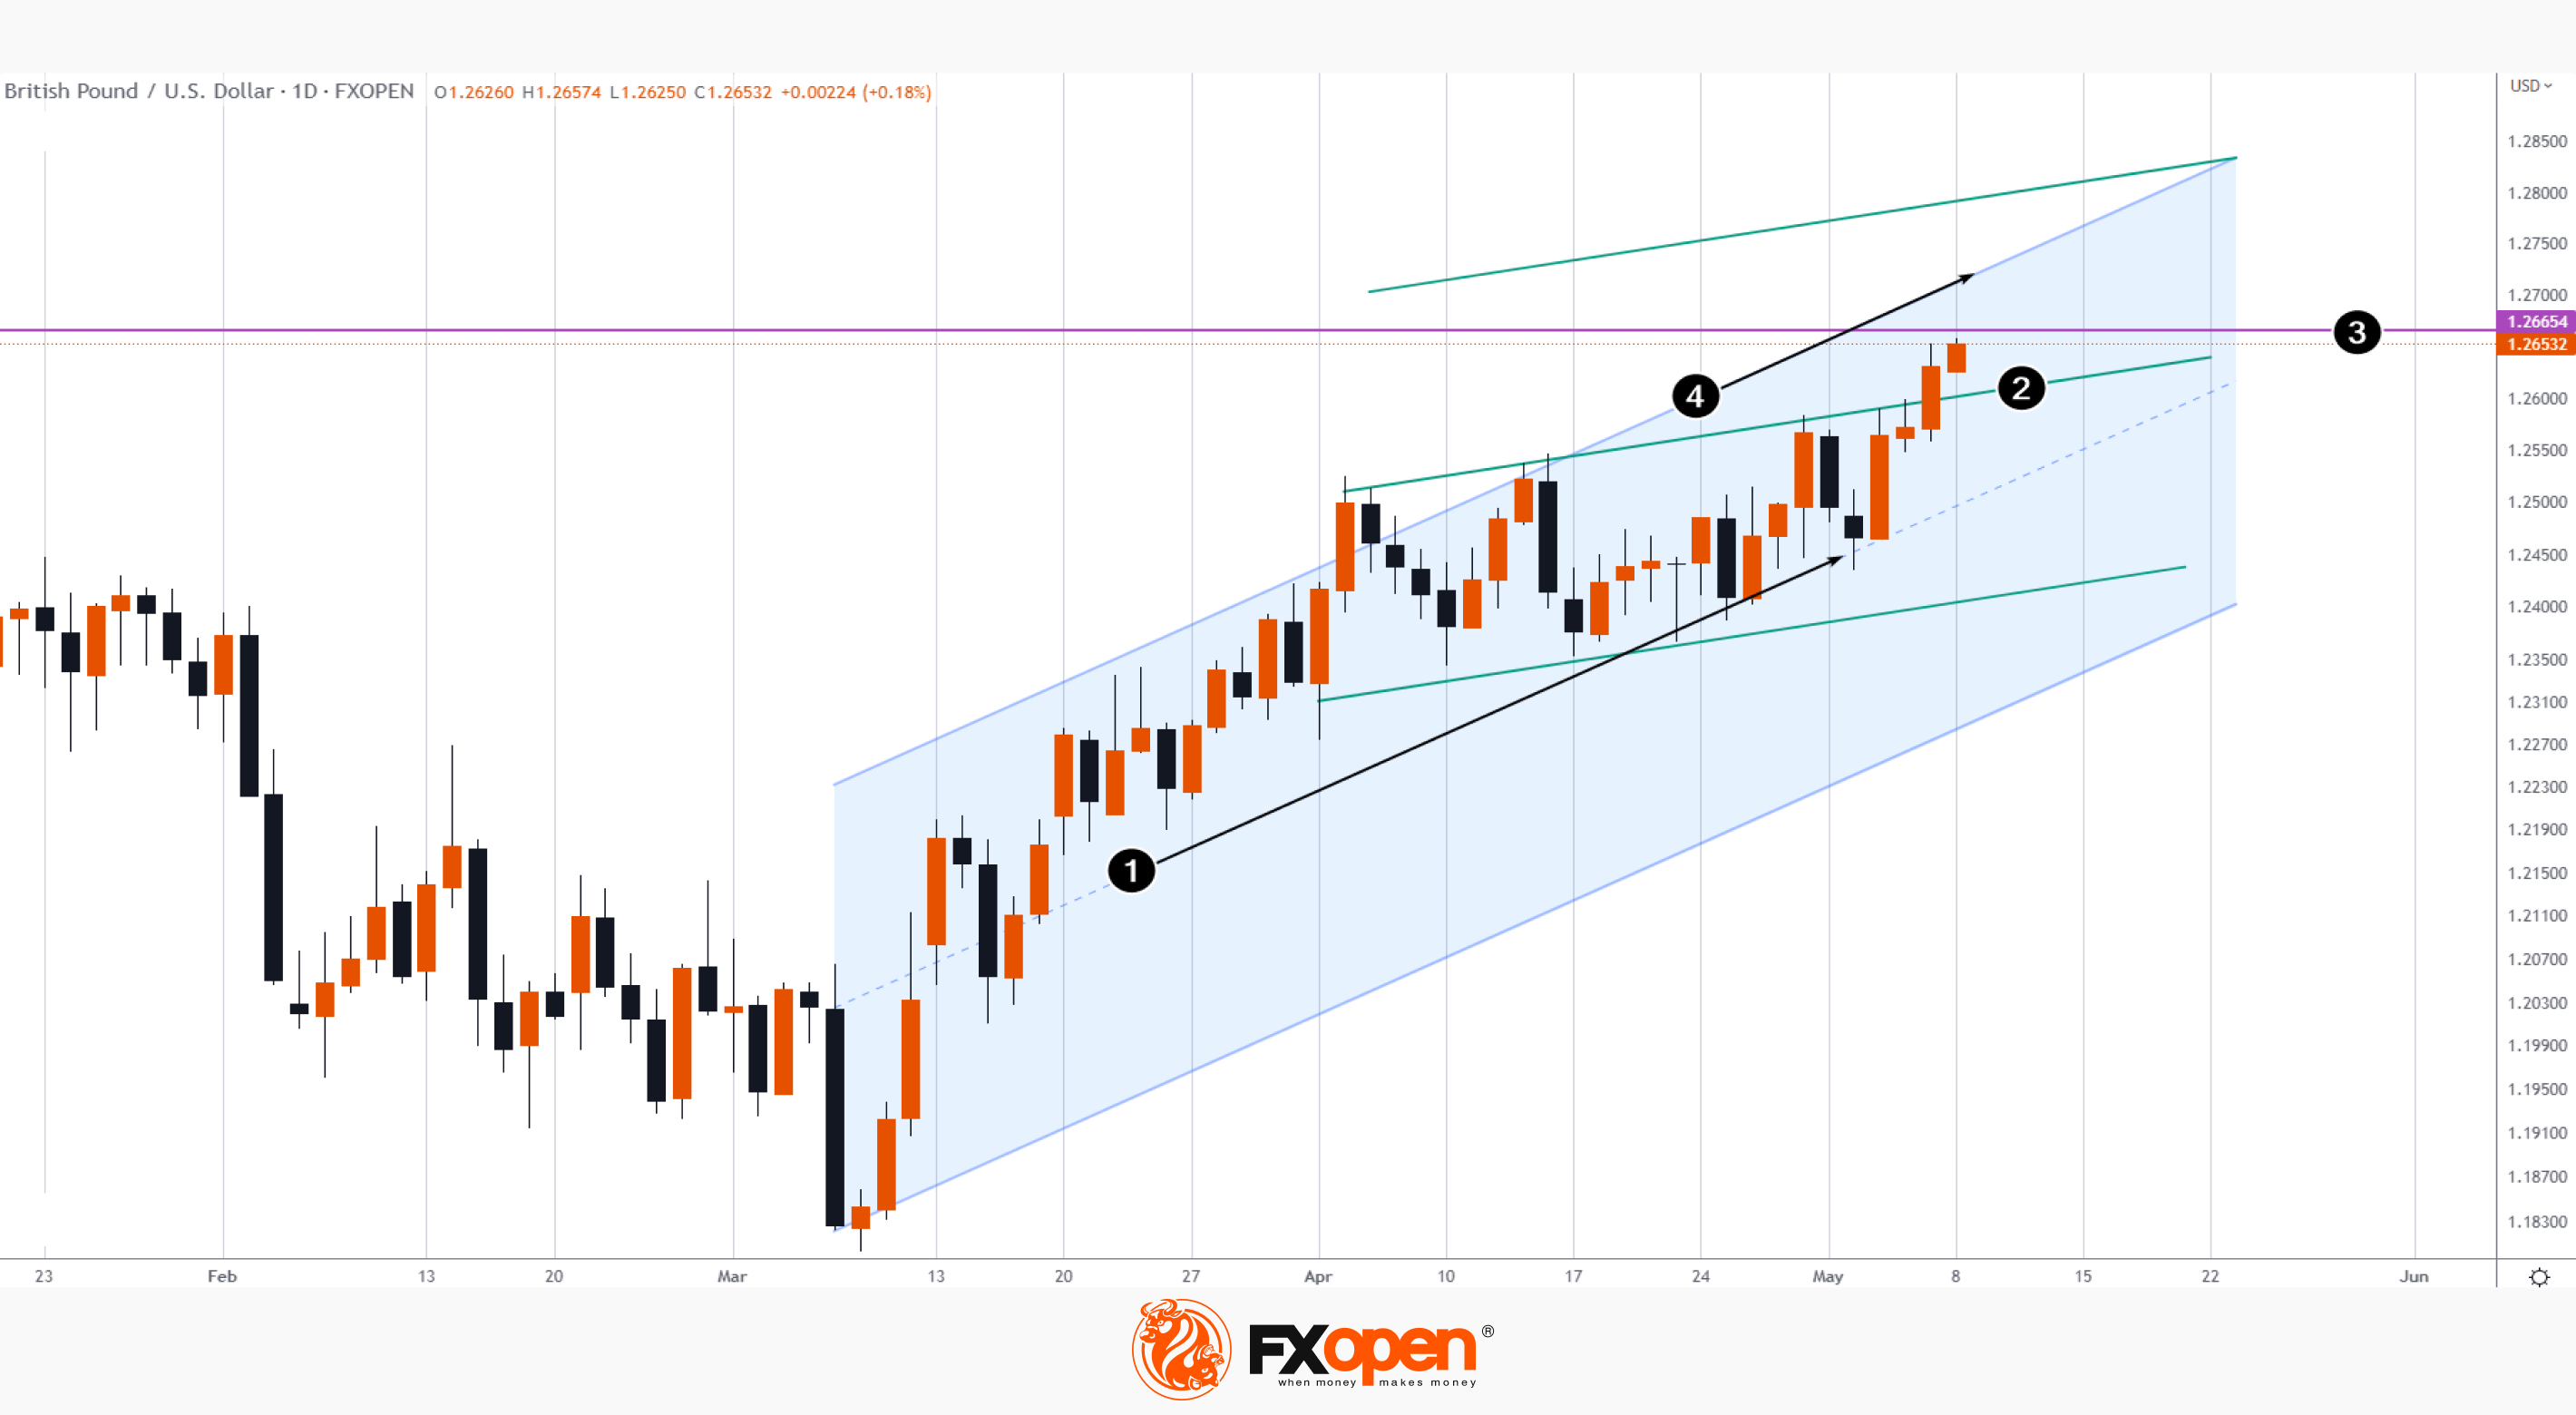
Technical analysis of the GBP/USD chart indicates that:
→ the median line of the growing channel (1) supports the market;
→ the rate has overcome the line (2), which offered resistance in April. Now the price can test this line from above;
→ the price is near the level of 1.2666 - this is an important peak on the GBP/USD forex chart in May 2022;
→ if the bullish trend strengthens, the price may reach the upper limit (4) of the ascending channel (shown in blue).
This article represents the opinion of the Companies operating under the FXOpen brand only. It is not to be construed as an offer, solicitation, or recommendation with respect to products and services provided by the Companies operating under the FXOpen brand, nor is it to be considered financial advice.
Trade over 50 forex markets 24 hours a day with FXOpen. Take advantage of low commissions, deep liquidity, and spreads from 0.0 pips (additional fees may apply). Open your FXOpen account now or learn more about trading forex with FXOpen.
This article represents the opinion of the Companies operating under the FXOpen brand only. It is not to be construed as an offer, solicitation, or recommendation with respect to products and services provided by the Companies operating under the FXOpen brand, nor is it to be considered financial advice.
Stay ahead of the market!
Subscribe now to our mailing list and receive the latest market news and insights delivered directly to your inbox.


Latest articles

AI Valuations Are Back in the Spotlight
Artificial intelligence remains the dominant investment theme of 2026, but investors are increasingly questioning whether AI stock valuations are keeping pace with reality.
💰 Big Tech continues to invest at an unprecedented scale, with hyperscaler AI spending projected to exceed $800

AUD/CAD: Months of Indecision — Is a Breakout Finally Coming?
The Australian dollar has clawed back most of its end-of-June losses, when it touched three-month lows against the greenback amid escalating Middle East tensions. Since then, sentiment has improved: the RBA's Assistant Governor Sarah Hunter signalled the board stands ready

USD/JPY: Battling at the Top of the Triangle
On 3 July, Japan's Finance Minister, Satsuki Katayama, stated that the Ministry of Finance remains in close contact with US authorities regarding developments in USD/JPY as the yen traded near its weakest level in almost 40 years. Similar verbal