


Market Analysis: INTC Shares Up 16% in Just One Week
FXOpen

INTC shares have underperformed in the tech sector for years (due to equipment obsolescence and a lack of innovation as well), but last week was the best week since July 2009. The reason for the rise is related to the hype around AI.
According to rumors, the company has released a new processor that shows good results when training neural networks. And one analyst opined that Intel could gain a competitive advantage from its acquisition of chip maker Habana Labs/Gaudi.
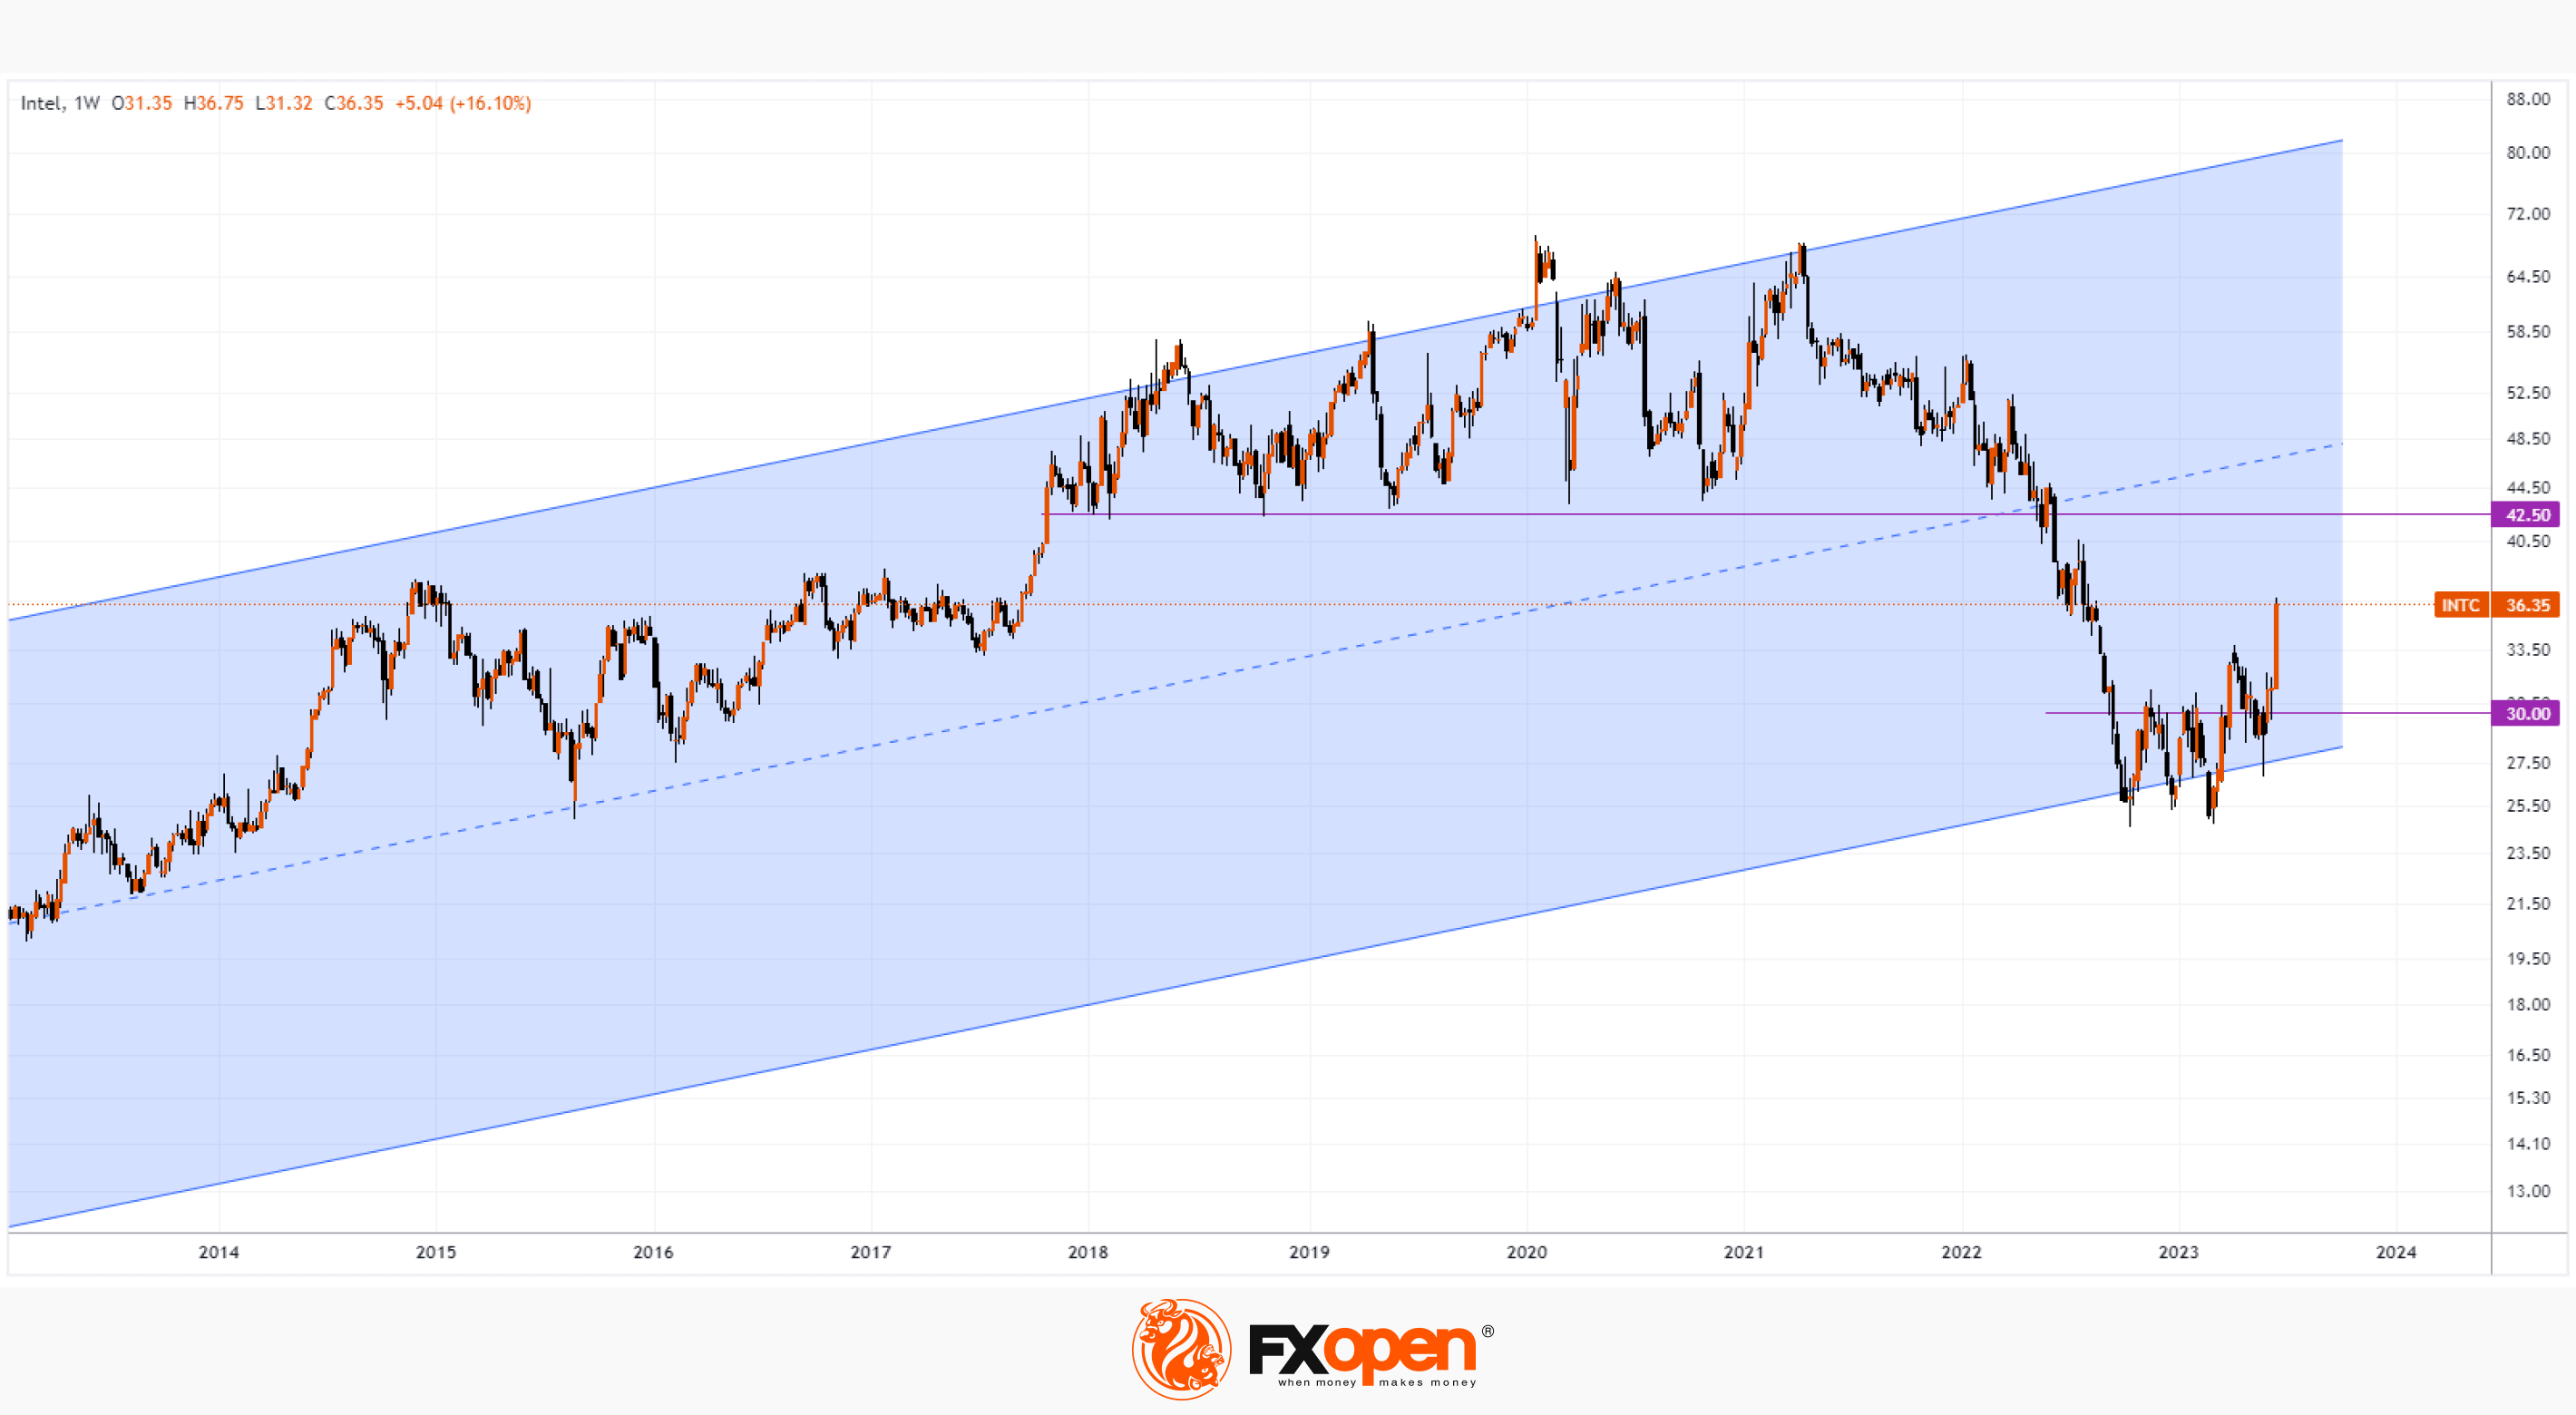
INTC's stock chart shows that INTC's stock price bounced off the lower end of a long-term up channel after hovering between USD 25 and USD 30 per share for a long time. It was probably an accumulation range when large market participants formed an investment position. Now we can expect the USD 30 level to serve as support. On the other hand, the strong level of USD 42.50 per share of INTC starting in 2018 could provide resistance.
On Friday, Morgan Stanley analyst Joseph Moore raised its price target for Intel shares to USD 38 from USD 31. But if the bulls continue to act as actively, the target levels for the INTC stock may be raised again.
Buy and sell stocks of the world's biggest publicly-listed companies with CFDs on FXOpen’s trading platform. Open your FXOpen account now or learn more about trading share CFDs with FXOpen.
This article represents the opinion of the Companies operating under the FXOpen brand only. It is not to be construed as an offer, solicitation, or recommendation with respect to products and services provided by the Companies operating under the FXOpen brand, nor is it to be considered financial advice.
Stay ahead of the market!
Subscribe now to our mailing list and receive the latest market news and insights delivered directly to your inbox.


Latest articles

USD/JPY and USD/CHF Near Key Levels: The Dollar Supported by the Fed
The US dollar continues to trend upwards following the Federal Reserve meeting, drawing support from the regulator’s moderately hawkish stance and comments by Jerome Powell. Markets interpret the Fed’s rhetoric as a signal that restrictive policy is likely

EUR/USD and GBP/USD consolidate ahead of the Fed decision
European currencies are showing subdued dynamics, entering a consolidation phase following their previous advance. Earlier, EUR/USD and GBP/USD broke out of their ranges and strengthened; however, the subsequent correction has led both pairs to retest the previously breached

Meta: V-Shaped Recovery Meets Heavy Volume Resistance
The movement in Meta Platforms shares is being driven by two competing narratives. On one hand, advertising revenue is benefiting from AI-based tools: the Advantage+ platform continues to support strong advertiser demand, and the analyst consensus for Q1 2026 revenue