


Market Analysis: Natural Gas Prices Fall to More than 2-month Lows
FXOpen

Yesterday, XNG/USD quotes dropped below the 2,900 level for the first time since mid-September. This was helped by the fact that the NatGasWeather weather forecasting model late last week showed a cooling trend in December in the US, but this was replaced by warming over the weekend.
According to analyst forecasts from Analysts Tudor, Pickering, Holt & Co., published on Monday:
→ natural gas reserves at the end of winter could be 2 trillion cubic feet (previously forecast 1.9 trillion);
→ price could be USD 2.75 (previous forecast was USD 3 or less).
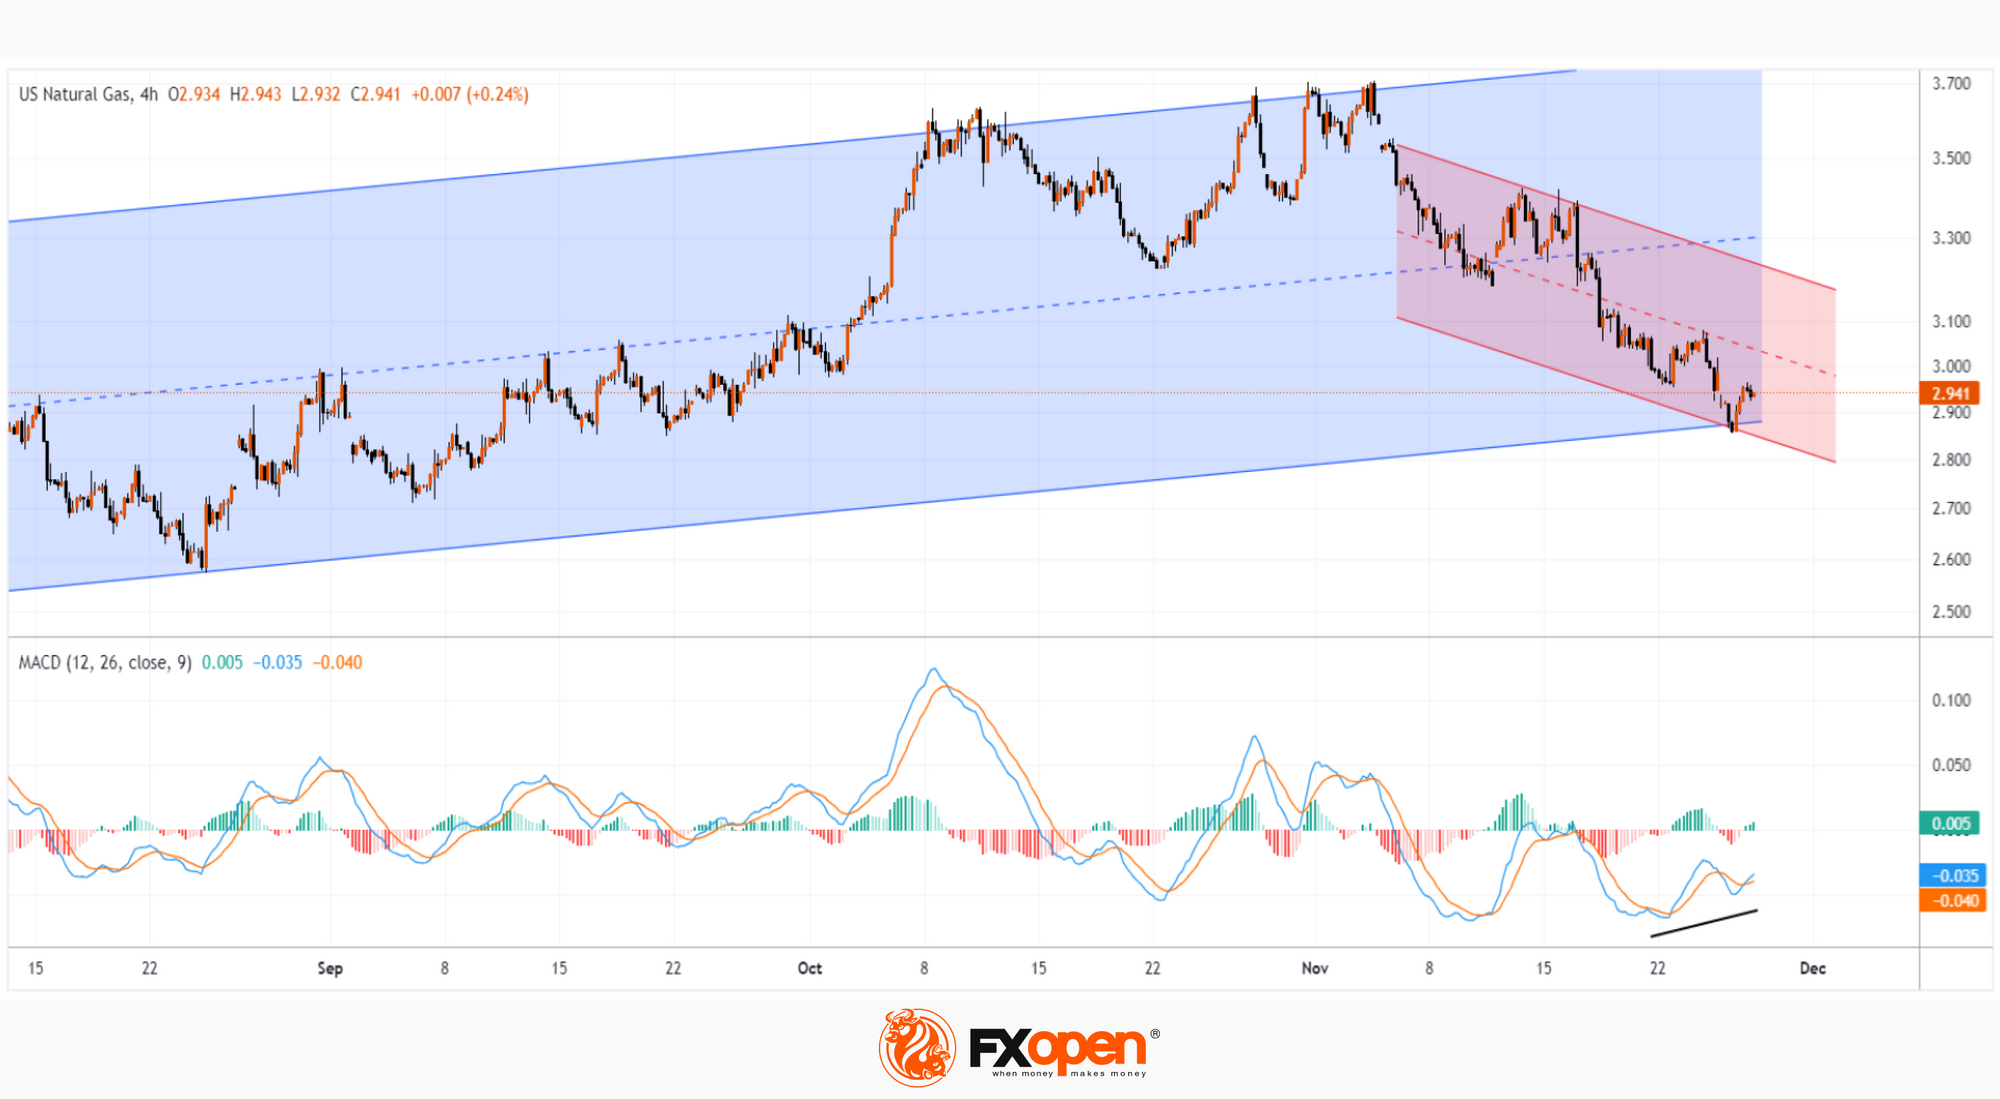
Meanwhile, the US Natural Gas price chart shows that:
→ the price of natural gas is near the lower border of the channel (shown in blue), which can provide support;
→ the MACD indicator indicates divergence (a sign of weakening selling pressure).
Thus, although the market has been in a bearish trend since the beginning of November (shown in red), the chart shows bullish signs — it is possible that the price in the short term may rise to the upper limit of the red channel. The likelihood of this scenario will increase if the weather forecasting model indicates a cold snap.
Start trading commodity CFDs with tight spreads (additional fees may apply). Open your trading account now or learn more about trading commodity CFDs with FXOpen.
This article represents the opinion of the Companies operating under the FXOpen brand only. It is not to be construed as an offer, solicitation, or recommendation with respect to products and services provided by the Companies operating under the FXOpen brand, nor is it to be considered financial advice.
Stay ahead of the market!
Subscribe now to our mailing list and receive the latest market news and insights delivered directly to your inbox.


Latest articles

Amazon Earnings: Does the Chart Already Know Something the Numbers Don't?
All eyes are on July 30, when Amazon reports Q2 2026 earnings, with Wall Street increasingly convinced the bar has been set too low. Consensus sees EPS near $1.82-$2.26 on roughly $197 billion in revenue, but the

WTI Analysis: Gap Breaks Short-Term Trend as Price Remains Trapped Between the POC and Profile Boundary
WTI crude oil plunged by more than 7% on 27 July 2026 after the US suspended a series of strikes against Iran over the weekend, raising hopes of a diplomatic solution and the reopening of shipping through the Strait of

US Dollar Index: A Defining Week for the King of the Markets
The dollar heads into a pivotal week trading near 101.80, just off a 15-month high, with the Fed's July 29 meeting standing as the clear focal point. Markets currently price roughly a 65% chance of a hold, though renewed