FXOpen

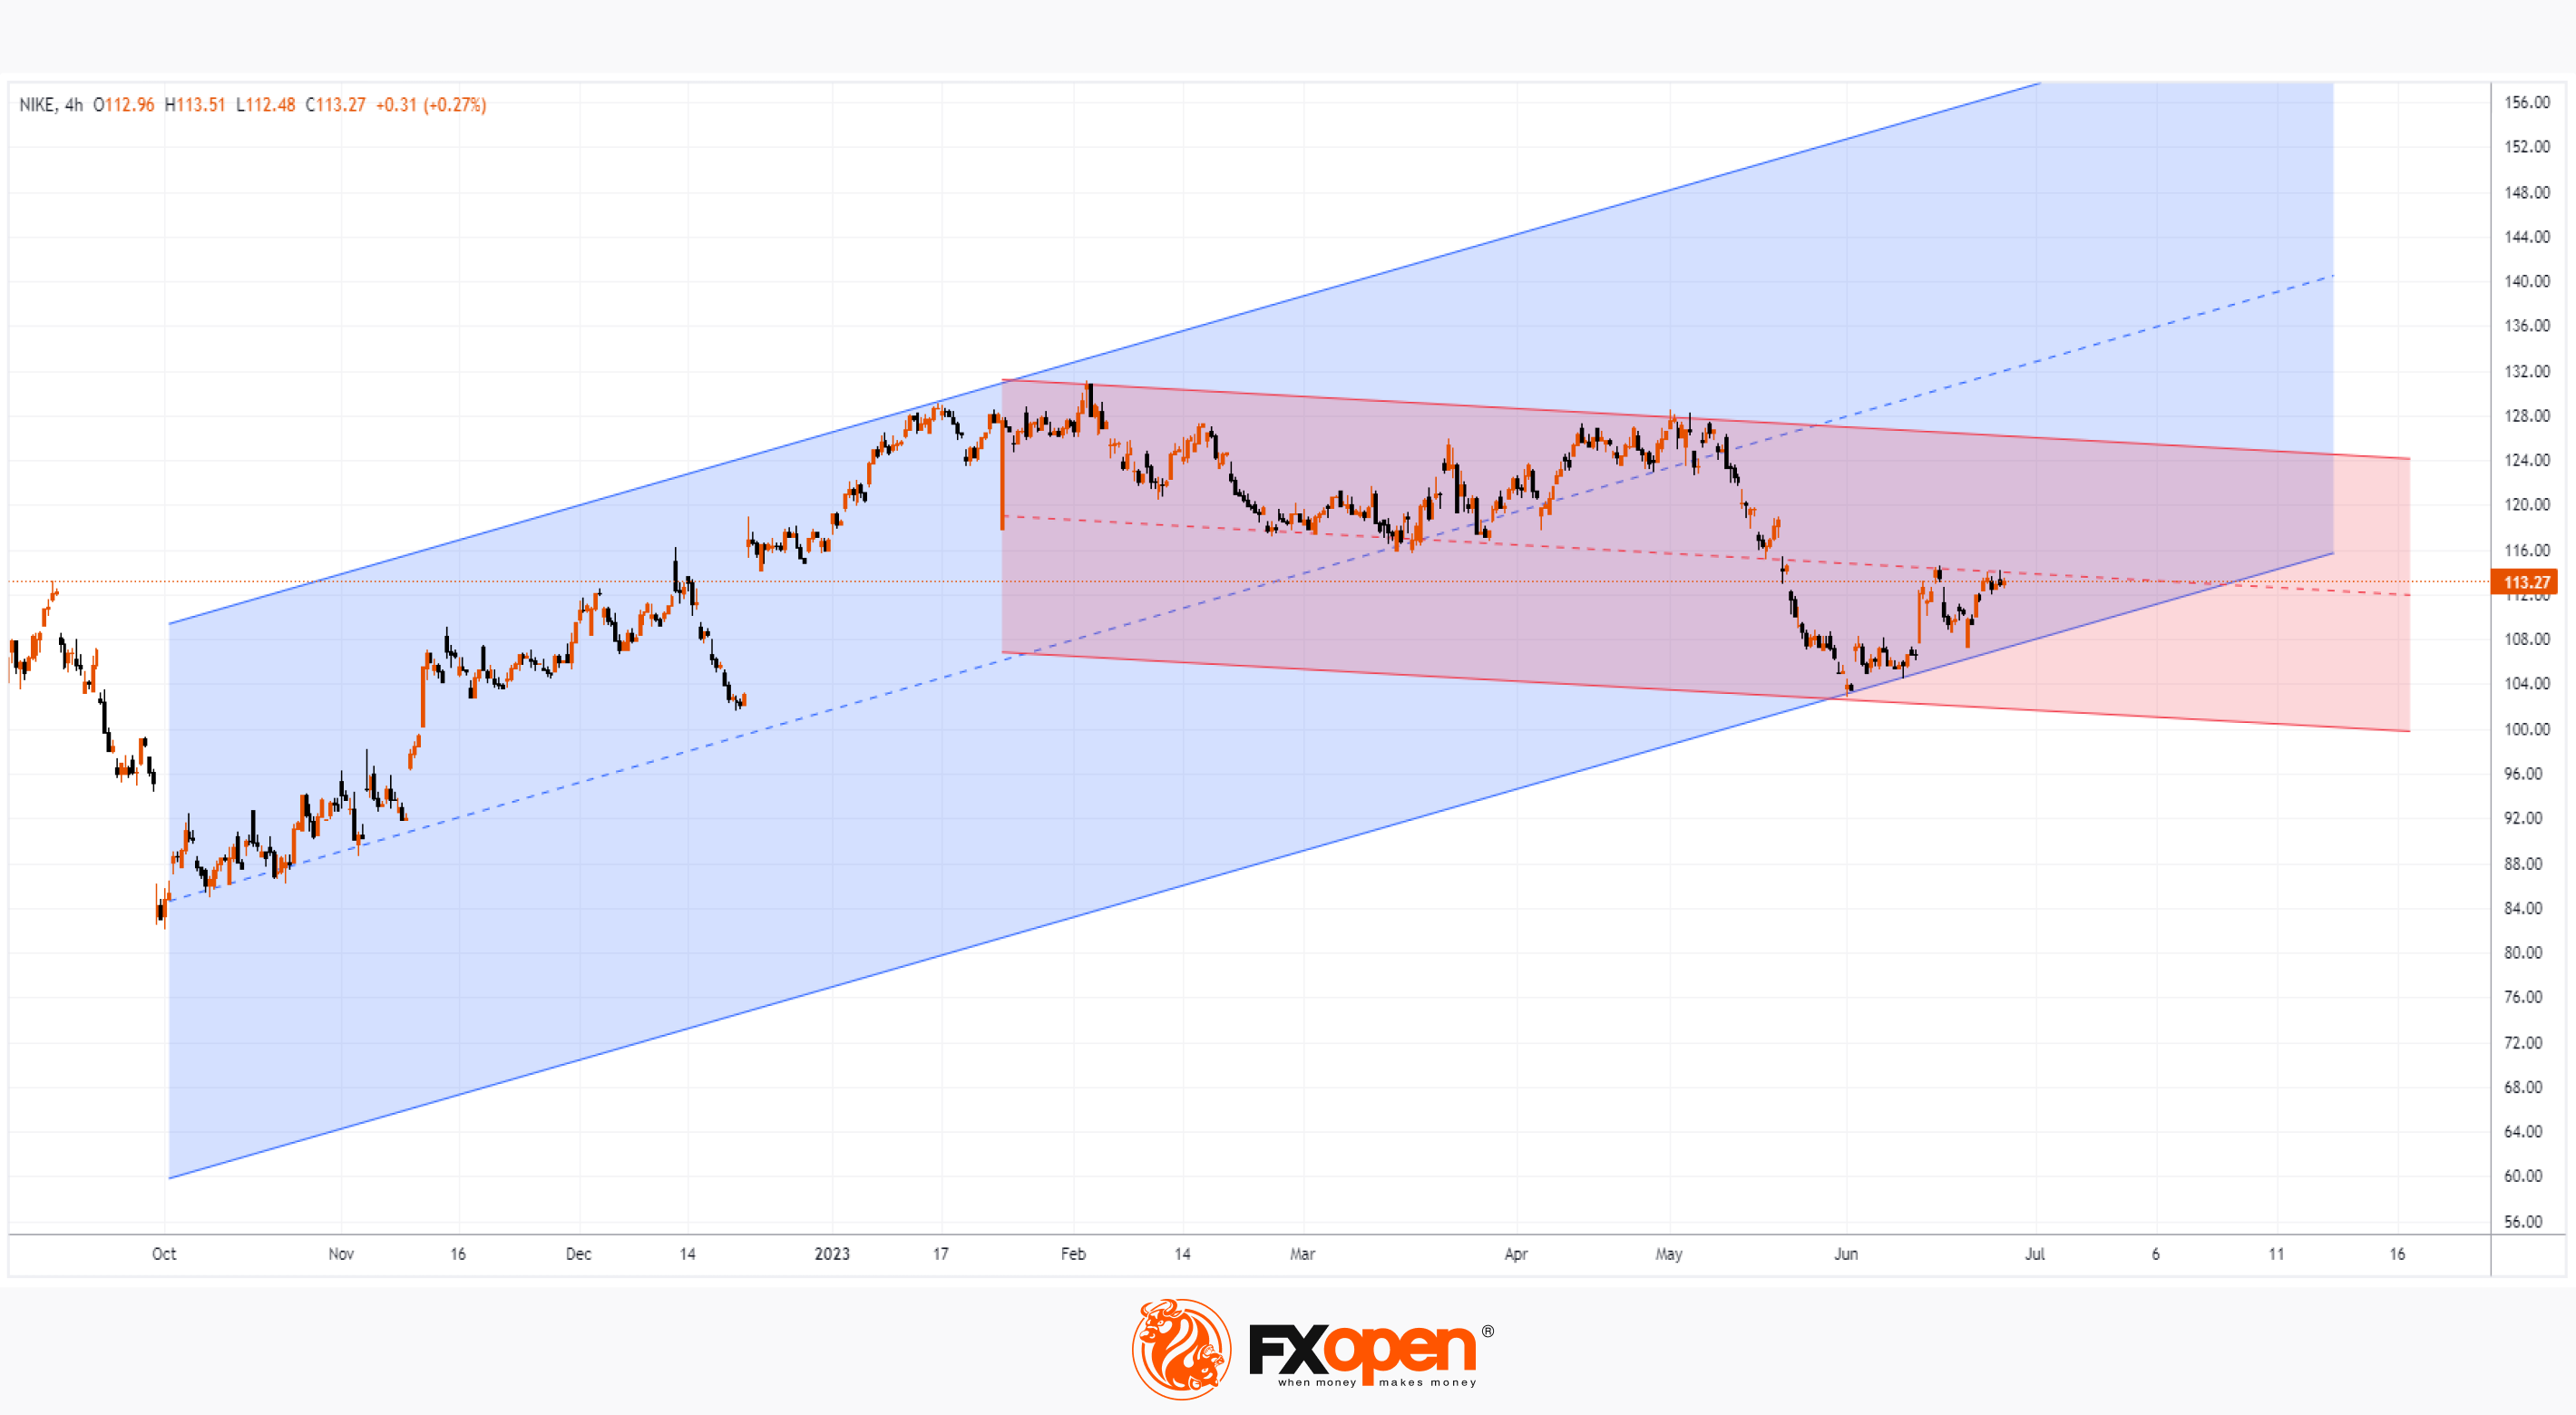
Yesterday, NKE's share price closed above USD 113, but trading today could open below USD 109 per Nike share.
The reason is in the weak report released by the company. Analysts note a drop in demand for products, which may mean a "wake-up call" for consumption in the US economy, squeezed by tight monetary policy.
According to finance professor Jeremy Siegel, "it's hard to see a lot of upside catalysts for the market in the second half of this year." The AI-driven rally is no guarantee that the US economy, which is made up of more than just tech companies, will not slip into recession.
The NKE stock chart shows that the price today will fluctuate around the lower border of the rising channel (shown in blue), which is valid in 2023. However, after a series of bounces seen in June, the bears may push through this support line to dominate the down channel (shown in red).
Buy and sell stocks of the world's biggest publicly-listed companies with CFDs on FXOpen’s trading platform. Open your FXOpen account now or learn more about trading share CFDs with FXOpen.
This article represents the opinion of the Companies operating under the FXOpen brand only. It is not to be construed as an offer, solicitation, or recommendation with respect to products and services provided by the Companies operating under the FXOpen brand, nor is it to be considered financial advice.
Stay ahead of the market!
Subscribe now to our mailing list and receive the latest market news and insights delivered directly to your inbox.


Latest articles

XTI/USD Chart Analysis: WTI Oil Price Fluctuates Near $100
For the third Monday in a row, trading in the oil market has opened with a bullish gap, although this time it is not as wide as the gap seen, for example, on 9 March. The reason for the volatility
Gold Price Falls to a Monthly Low
As the XAU/USD chart shows, gold prices today dropped below the 3 March low, reaching levels last seen in the third week of February.
Why Is Gold Declining Despite the War?
Geopolitical turmoil typically supports demand for gold as