


Market Analysis: Price of Gold Drops Below $1,950
FXOpen

This happened for the first time since mid-October, when gold was rapidly rising in price on fears related to the escalation of the military conflict in the Middle East.
At the same time, the psychological level of USD 2,000 per ounce demonstrated its importance.
Notice the volatility spikes around it — the bulls were active in the attacks, noticeable on the 4-hour chart, but all the progress made on the upward impulses was almost immediately canceled out by the bears.
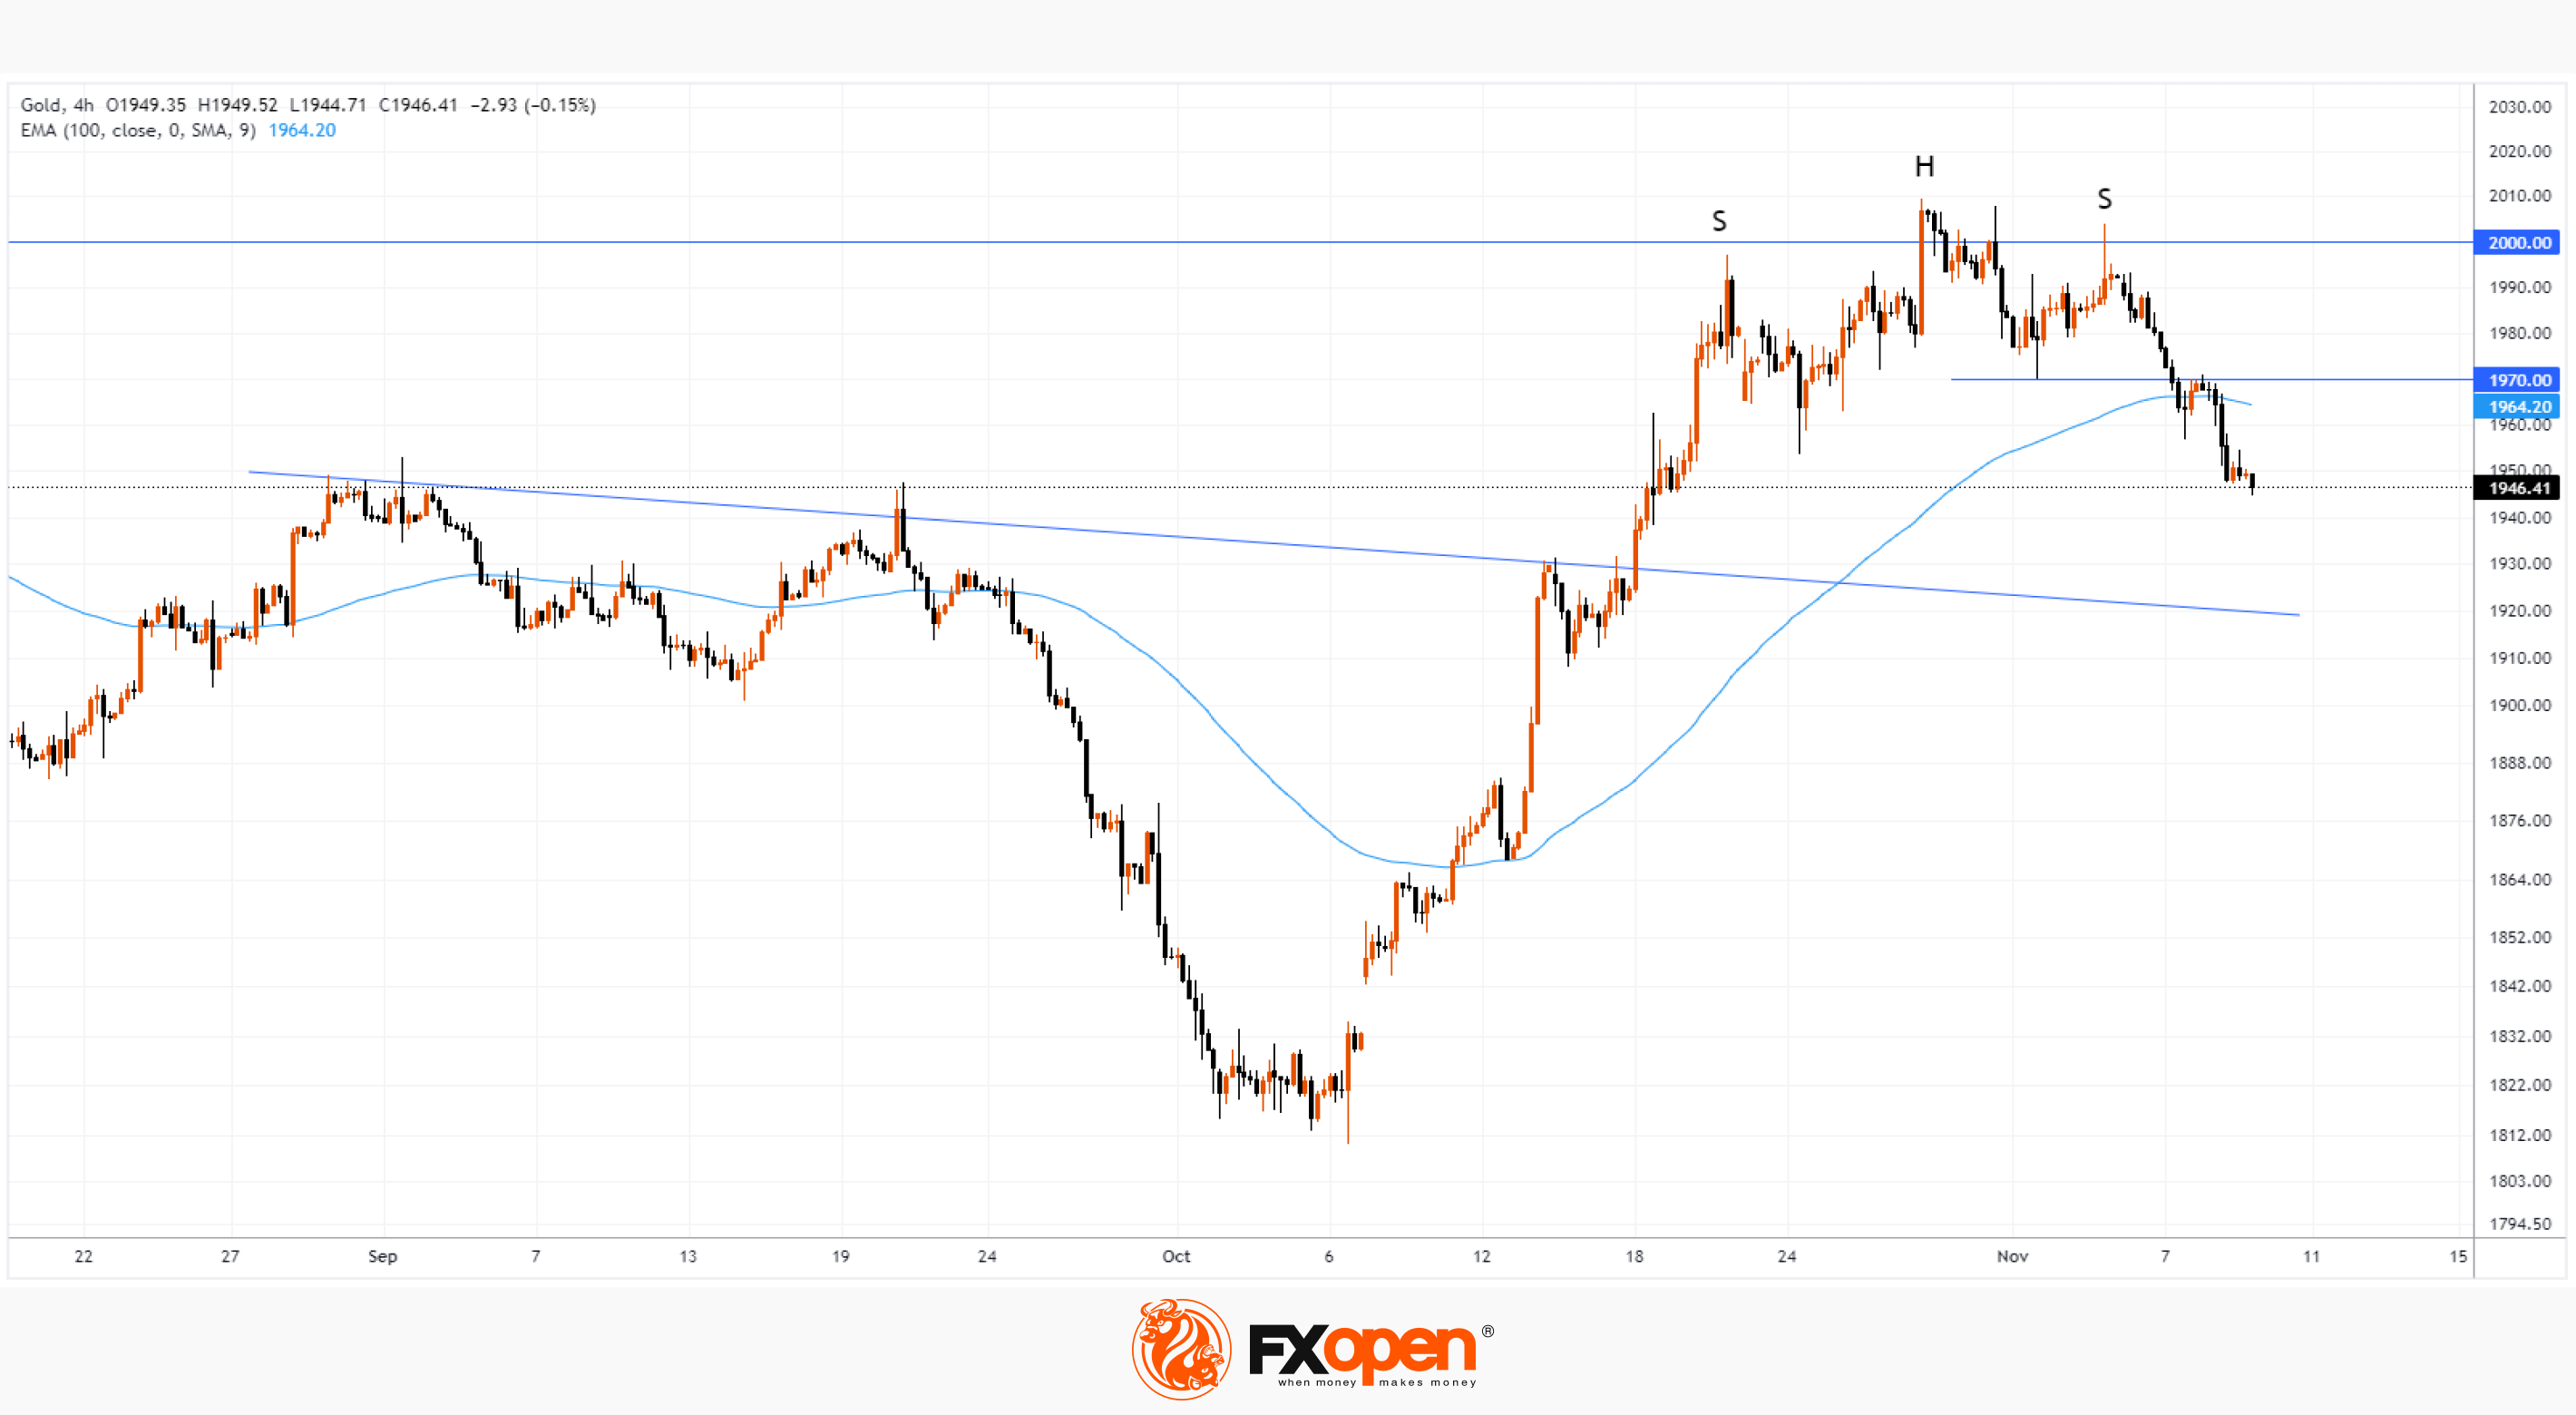
The graph shows:
→ formation of a reversal pattern SHS (head-and-shoulders). With some subjectivity, we can assume that the “neck” level is around USD 1,970. But it has already been broken after a weak rebound;
→ the price dropped below EMA (100).
The price can be supported by a trend line drawn at the highs of August-September. After a bullish breakout, it could serve as market support in the area of USD 1,915 per ounce. In the same area is the 50% Fib level of the upward momentum from the October lows to the peak above USD 2,000. If the price falls to the USD 1,910-1,920 zone, it could serve as a support for the bulls to try to resume the bullish trend, if the news background also contributes to this.
Start trading commodity CFDs with tight spreads (additional fees may apply). Open your trading account now or learn more about trading commodity CFDs with FXOpen.
This article represents the opinion of the Companies operating under the FXOpen brand only. It is not to be construed as an offer, solicitation, or recommendation with respect to products and services provided by the Companies operating under the FXOpen brand, nor is it to be considered financial advice.
Stay ahead of the market!
Subscribe now to our mailing list and receive the latest market news and insights delivered directly to your inbox.


Latest articles

Nasdaq 100: Is This the Correction Traders Have Been Waiting For?
The Nasdaq 100 (US Tech 100 Mini on FXOpen) remains caught between two opposing forces: cooling inflation on one side, and persistent geopolitical instability on the other. On 14 July, June's CPI print came in softer than expected, easing near-term
XRP/USD: Symmetrical Triangle Forms as Trading Volume Fades
On 6 July, Ripple received a full Crypto-Asset Service Provider (CASP) licence under the Markets in Crypto-Assets (MiCA) regulation from Luxembourg's financial regulator, the CSSF. The approval allows the company to offer regulated crypto payment services across all 30 countries

AI Valuations Are Back in the Spotlight
Artificial intelligence remains the dominant investment theme of 2026, but investors are increasingly questioning whether AI stock valuations are keeping pace with reality.
💰 Big Tech continues to invest at an unprecedented scale, with hyperscaler AI spending projected to exceed $800