


Market Analysis: S&P-500 Has Officially Ended the Bear Market
FXOpen
As of yesterday's trading session, the S&P 500 rose above 20% from the October 2022 low, a common trigger to believe that the bear market is over. By the way, according to Barron's, the decline lasted 248 trading days and was the longest since 1948.
To a large extent, the rise in the S&P 500 index, which ended the bear market, was due to the AI-related boom:
→ NVDA's share price is up about 170%.
→ META's share price is up about 110%.
→ MSFT's share price is up about 40%.
We also draw your attention to the action of the TSLA share price. It has risen by 115% since the beginning of the year, the bulls are approaching the upper limit (1) of the descending channel, which has been in effect since the fall of 2021. Also, the price of TSLA is fixed above the level of USD 215 per share, which previously served as both important resistance and support.
The bullish momentum this week was helped by the information that Tesla sent out a document to its partners, which reported the planned production volume of Cybertrack in the amount of 375k units per year — more than previously expected by Wall Street analysts. The expected product may go on sale at the end of the Q3.
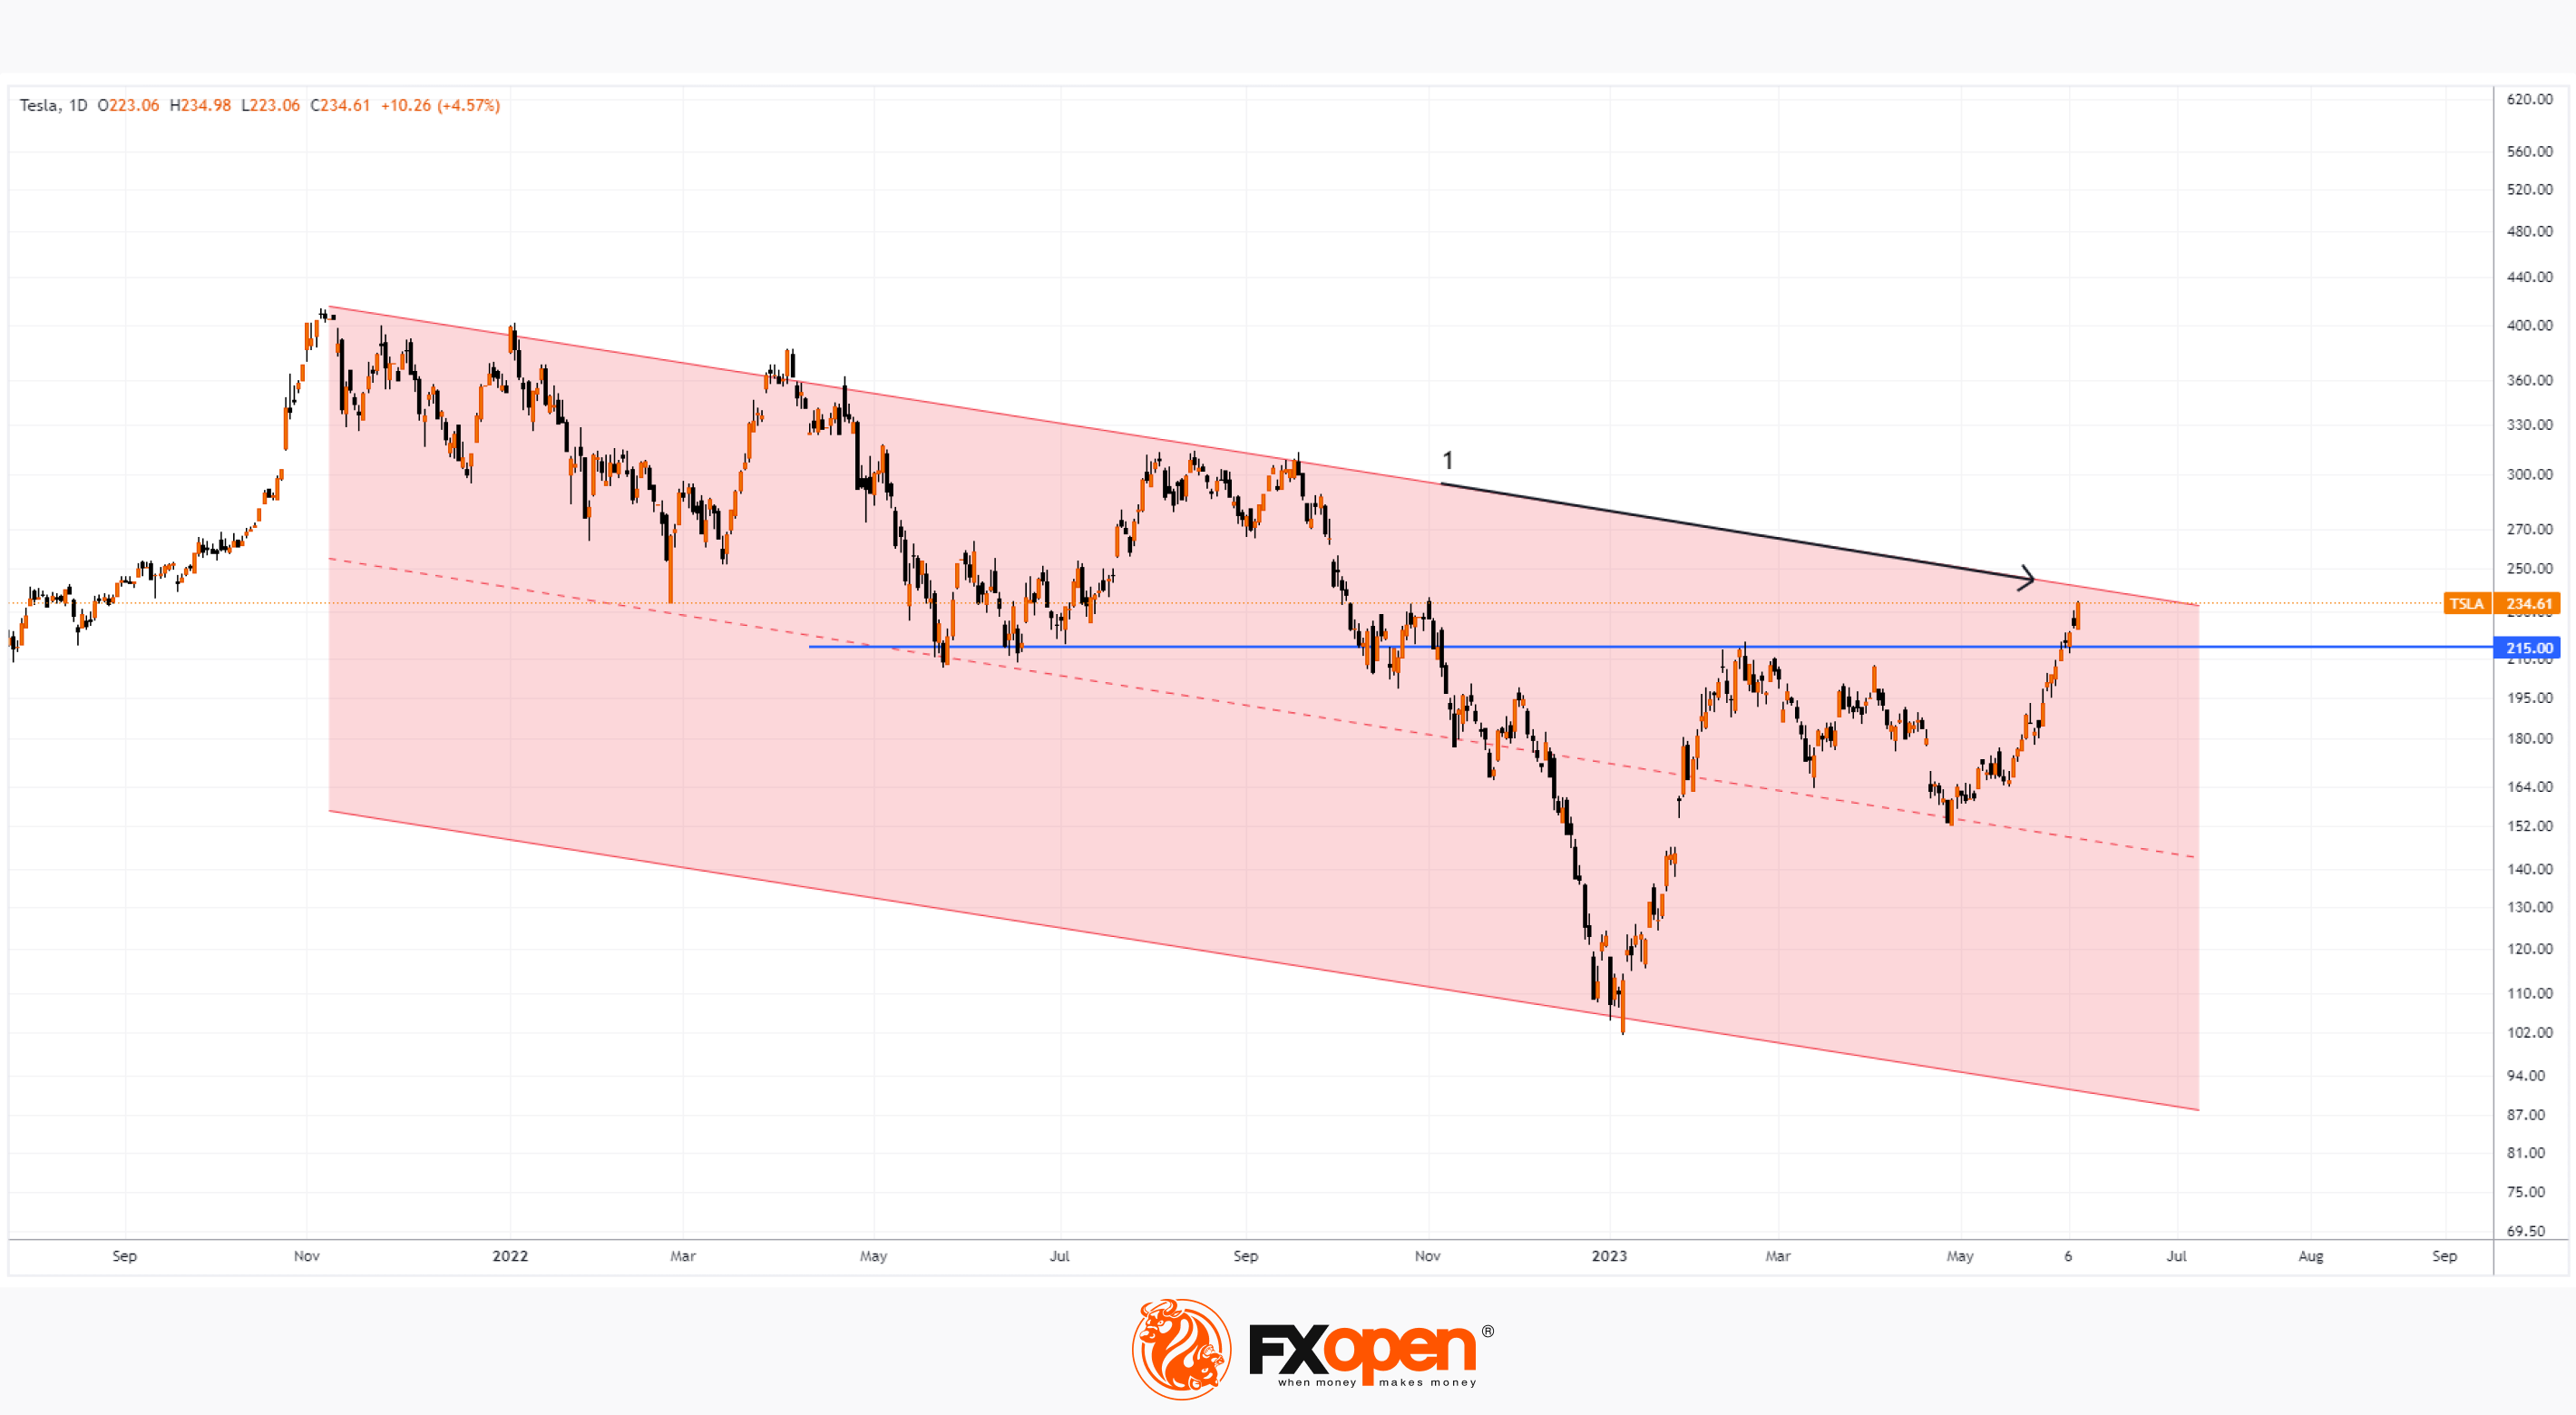
In premarket trading, TSLA's share price hit USD 245 today, although the WSJ survey puts the average TSLA price predicted by analysts at the end of 2023 at around USD 200. This discrepancy can be taken as an argument that the market is overheating and suggesting that TSLA's share price is vulnerable to a pullback.
Buy and sell stocks of the world's biggest publicly-listed companies with CFDs on FXOpen’s trading platform. Open your FXOpen account now or learn more about trading share CFDs with FXOpen.
This article represents the opinion of the Companies operating under the FXOpen brand only. It is not to be construed as an offer, solicitation, or recommendation with respect to products and services provided by the Companies operating under the FXOpen brand, nor is it to be considered financial advice.
Stay ahead of the market!
Subscribe now to our mailing list and receive the latest market news and insights delivered directly to your inbox.


Latest articles

EUR/USD Eyes Gains As USD/CHF Weakness Deepens Again
EUR/USD started a fresh increase above 1.1700 and 1.1720. USD/CHF declined further and is now struggling below 0.7835.
Important Takeaways for EUR/USD and USD/CHF Analysis Today
· The Euro started a decent increase from

Apple: Earnings Day Above the Activity Zone
On 30 April, after the market close, Apple Inc. will release its financial results for the second quarter of fiscal 2026. The consensus forecast, based on estimates from 31 analysts, points to revenue of around $109.7 billion, with expected

USD/JPY and USD/CHF Near Key Levels: The Dollar Supported by the Fed
The US dollar continues to trend upwards following the Federal Reserve meeting, drawing support from the regulator’s moderately hawkish stance and comments by Jerome Powell. Markets interpret the Fed’s rhetoric as a signal that restrictive policy is likely