


FXOpen

E-mini S&P 500 futures are near 2023 highs. At the same time, the daily chart of the E-mini S&P 500 shows that the current price of the futures has consolidated above a series of lower peaks 1→2→3→4, which is a bullish sign.
However, WSJ analysts draw attention to an important detail — too much dependence of the growth of the index on the strong behavior of a very small number of stocks. We are talking about Alphabet, Amazon, Apple, Meta, Microsoft, Nvidia. Their share in the index capitalization is about 30%, although at the beginning of the year it was about 20%.
E-mini S&P 500 futures are up 12% since the start of the year as these strong tech stocks carry more weight in the index. But if you calculate the dynamics of the index so that each share included in it will have an equal weight, then the growth will be less than 2%. This is the largest imbalance on record (since 1990).
The danger is vulnerability: if the bullish trend, which affects a narrow circle of leaders in one sector, ends or changes to a bearish one, this will create conditions for a fall in the values of the broad stock market index. As an example, this could be seen in September 2020, when the E-mini S&P 500 price fell by 10% in just 3 weeks due to a decline in technology stock prices.
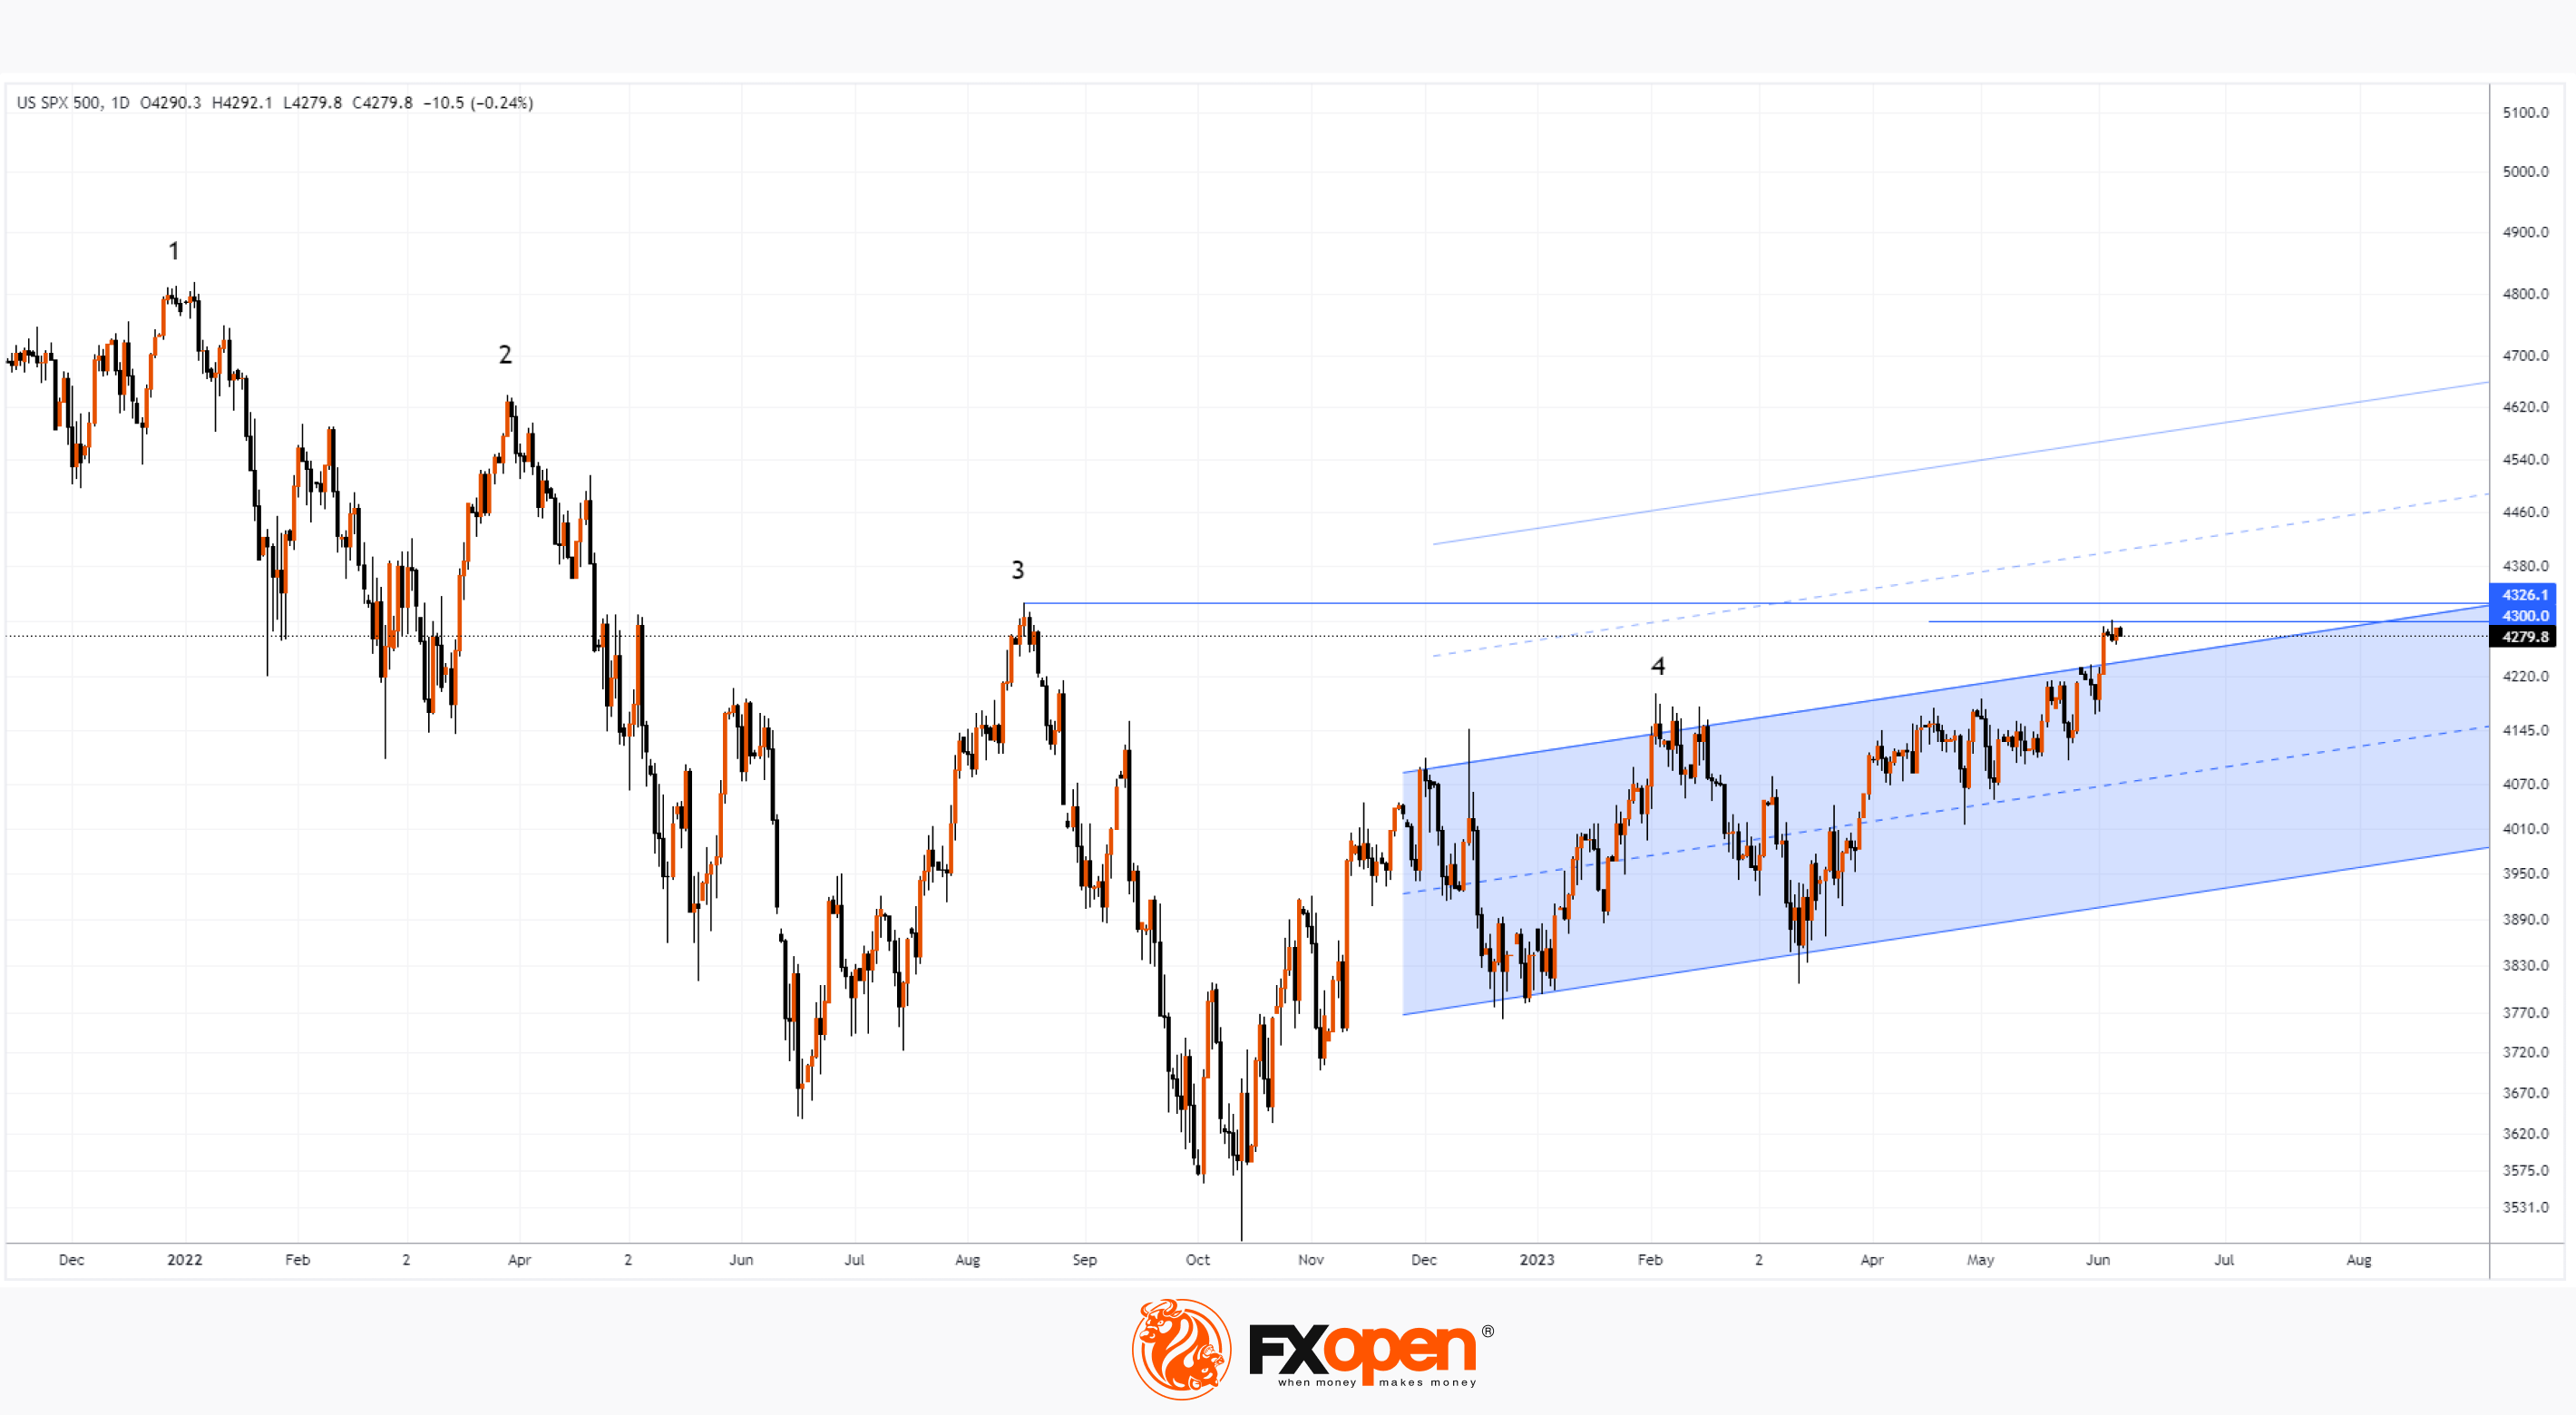
To what extent are the fears justified in the current situation? Perhaps the next two resistance levels (psychological 4,300 and top #3) will help provide an answer.
Trade global index CFDs with zero commission and tight spreads. Open your FXOpen account now or learn more about trading index CFDs with FXOpen.
This article represents the opinion of the Companies operating under the FXOpen brand only. It is not to be construed as an offer, solicitation, or recommendation with respect to products and services provided by the Companies operating under the FXOpen brand, nor is it to be considered financial advice.
Stay ahead of the market!
Subscribe now to our mailing list and receive the latest market news and insights delivered directly to your inbox.


Latest articles

The US Dollar Index (DXY) Rebounds from a Two-Month Low
A week ago, we:
→ updated a system of two trend channels;
→ identified signs of selling pressure dominance;
→ outlined a scenario in which price could slide towards the lower boundary of the blue channel, potentially acting as key support.
As the

Tesla (TSLA) Shares Close at a Record High
On Tuesday, 16 December 2025, Tesla shares closed at a new all-time high, breaking above the $488 level.
As a result, TSLA:
→ surpassed its December 2024 peak;
→ is up by roughly 125% from this year’s lows;
→ made Elon Musk

USD/JPY and USD/CAD Under Pressure After Weak US Labour Market Data
The US jobs report for November, released yesterday, reinforced the downward momentum in the dollar. The Department of Labor reported that non-farm payrolls rose by just 64,000, only slightly above analysts’ expectations and signalling a fragile recovery in the