


FXOpen
The CPI index values published yesterday showed that inflation in the US has increased slightly, but increased: actual = 3.7% in annual terms (expected = 3.6%, last month = 3.2%). According to the FT, the main reason is rising energy prices.
Recent data shows that the Fed's fight against inflation is becoming more difficult. Nevertheless, the markets perceived the event positively, as:
→ during a surge in volatility, the price of E-mini S&P 500 futures dropped to a minimum of the week, but the day closed at its maximum;
→ in the early hours of Thursday, the price increased.
Perhaps market participants believe that the Fed will be able to make a “soft landing.” By the way, Bank of America analysts, in a report dated September 11, wrote that the fall in the stock index from July highs represents a correction within the bull market that has been ongoing since the end of 2022.
On the other hand, Morgan Stanley analysts believe the S&P 500 could fall 25% if investors feel fearful as US stocks look risky and expensive. But BlackRock writes that the risk of recession remains high, since companies need to take out loans for business development at higher rates. And this will ultimately worsen financial reporting.
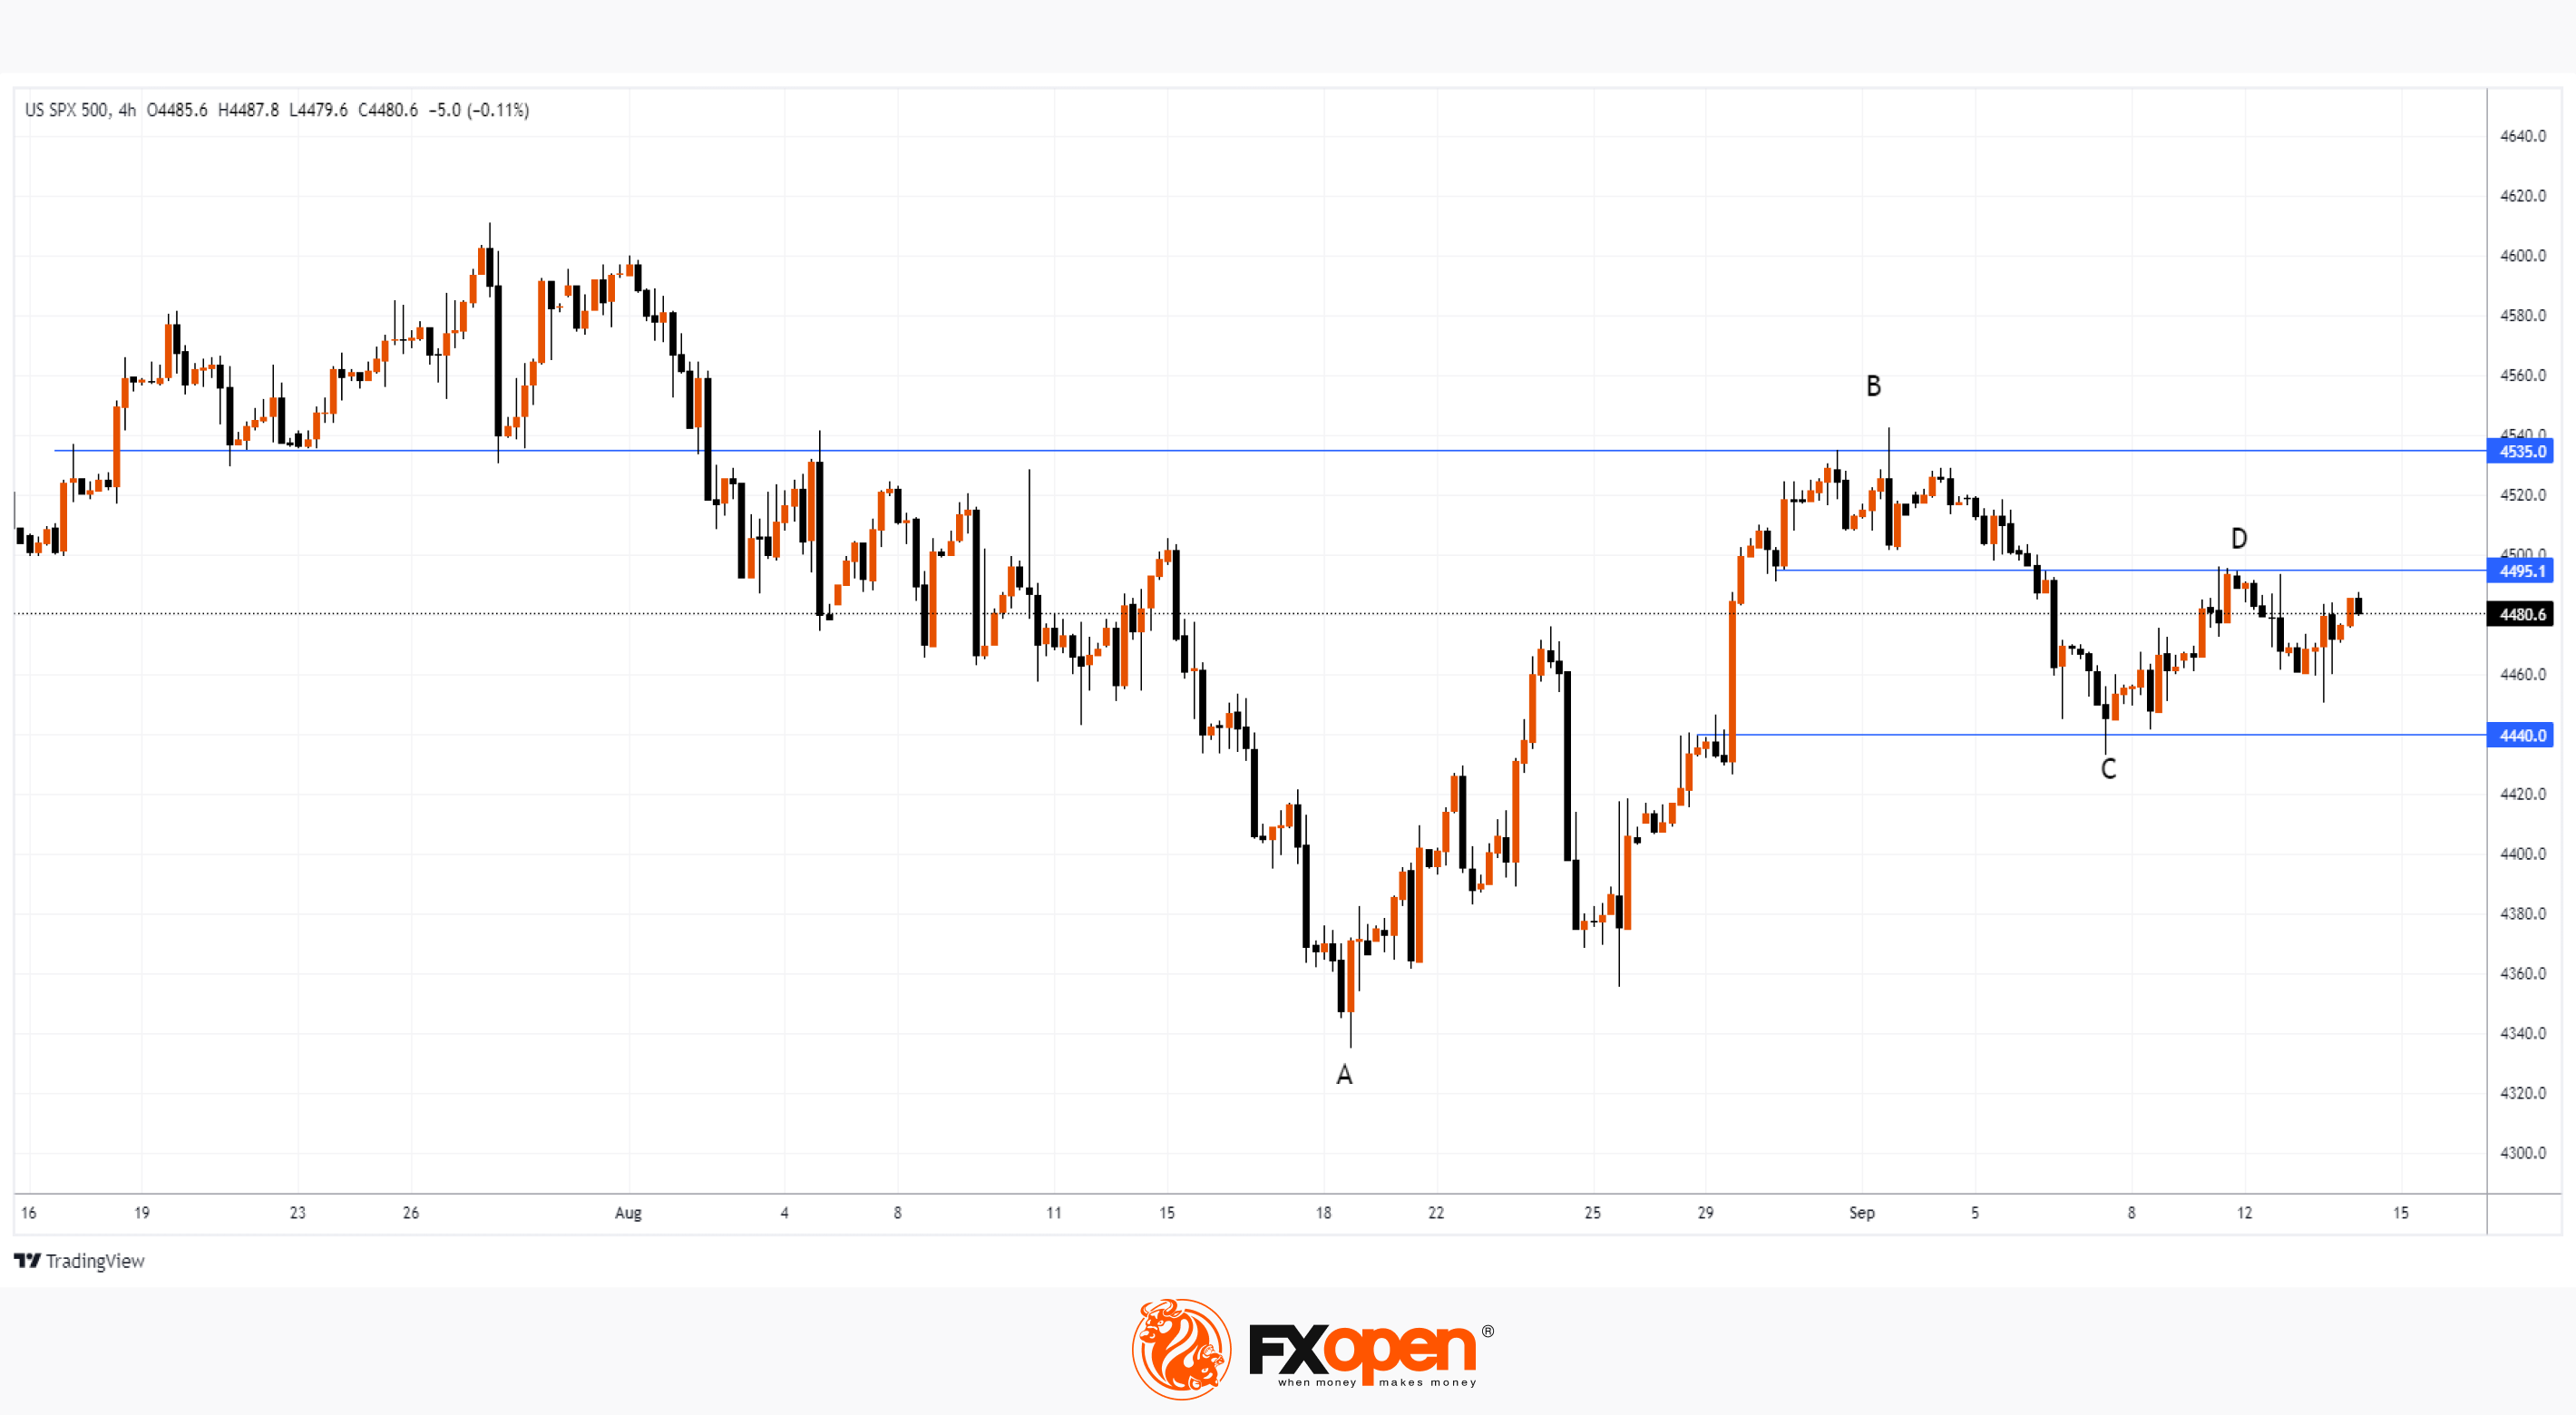
The difference in opinions is reflected in the chart, which suggests that the market is entering (or has already entered) a consolidation (flat) stage, since:
→ the decrease in B→C to the support line 4,440 is approximately 50% of the growth impulse A→B to the resistance line 4,535;
→ the growth of C→D to the resistance line 4,495 is approximately 50% of the declining impulse of A→B.
The damping of volatility can be interpreted in such a way that supply and demand balance each other. But September is traditionally a stormy month for stock markets. Let's see what its second half will be like - we are waiting for the meeting of central banks, the decisions of which will be announced next week.
Trade global index CFDs with zero commission and tight spreads (additional fees may apply). Open your FXOpen account now or learn more about trading index CFDs with FXOpen.
This article represents the opinion of the Companies operating under the FXOpen brand only. It is not to be construed as an offer, solicitation, or recommendation with respect to products and services provided by the Companies operating under the FXOpen brand, nor is it to be considered financial advice.
Stay ahead of the market!
Subscribe now to our mailing list and receive the latest market news and insights delivered directly to your inbox.


Latest articles

Market Analysis: EUR/USD Reclaims Ground While USD/JPY Momentum Fades
EUR/USD is recovering losses from 1.1500. USD/JPY is correcting gains from 159.00 and might decline further if it stays below 158.30.
Important Takeaways for EUR/USD and USD/JPY Analysis Today
- The Euro struggled to

S&P 500 Fluctuates Ahead of CPI Report
As the S&P 500 chart (US SPX 500 mini on FXOpen) shows, the index is trading near the 6,800 level this morning. However, the balance between supply and demand could change significantly after the release of the

XTI/USD Chart Analysis: Oil Prices Remain Volatile
Against the backdrop of military developments in the Middle East, the situation in the oil market is evolving rapidly. Only two days have passed since 9 March, when we published a morning analytical note in which we:
→ highlighted the rise