


Market Analysis: Shares of HPQ Fall Sharply after Report
FXOpen

→ Revenue decreased by 10% to USD 13.2 billion compared to USD 14.65 billion a year ago. This was the third quarter in a row that HP fell short of analysts' estimates.
→ “While we expect another quarter of sequential growth in Q4, the external environment has not improved as quickly as anticipated and we are moderating our expectations as a result,” said HP CEO Enrique Lores.
→ Earnings per share was 86 cents (in line with forecasts), and the company estimates earnings for the next quarter could be between 85 cents and 97 cents.
As a result, at yesterday's low, the fall in the share price of HP Inc. exceeded 10%. Can the fall continue?
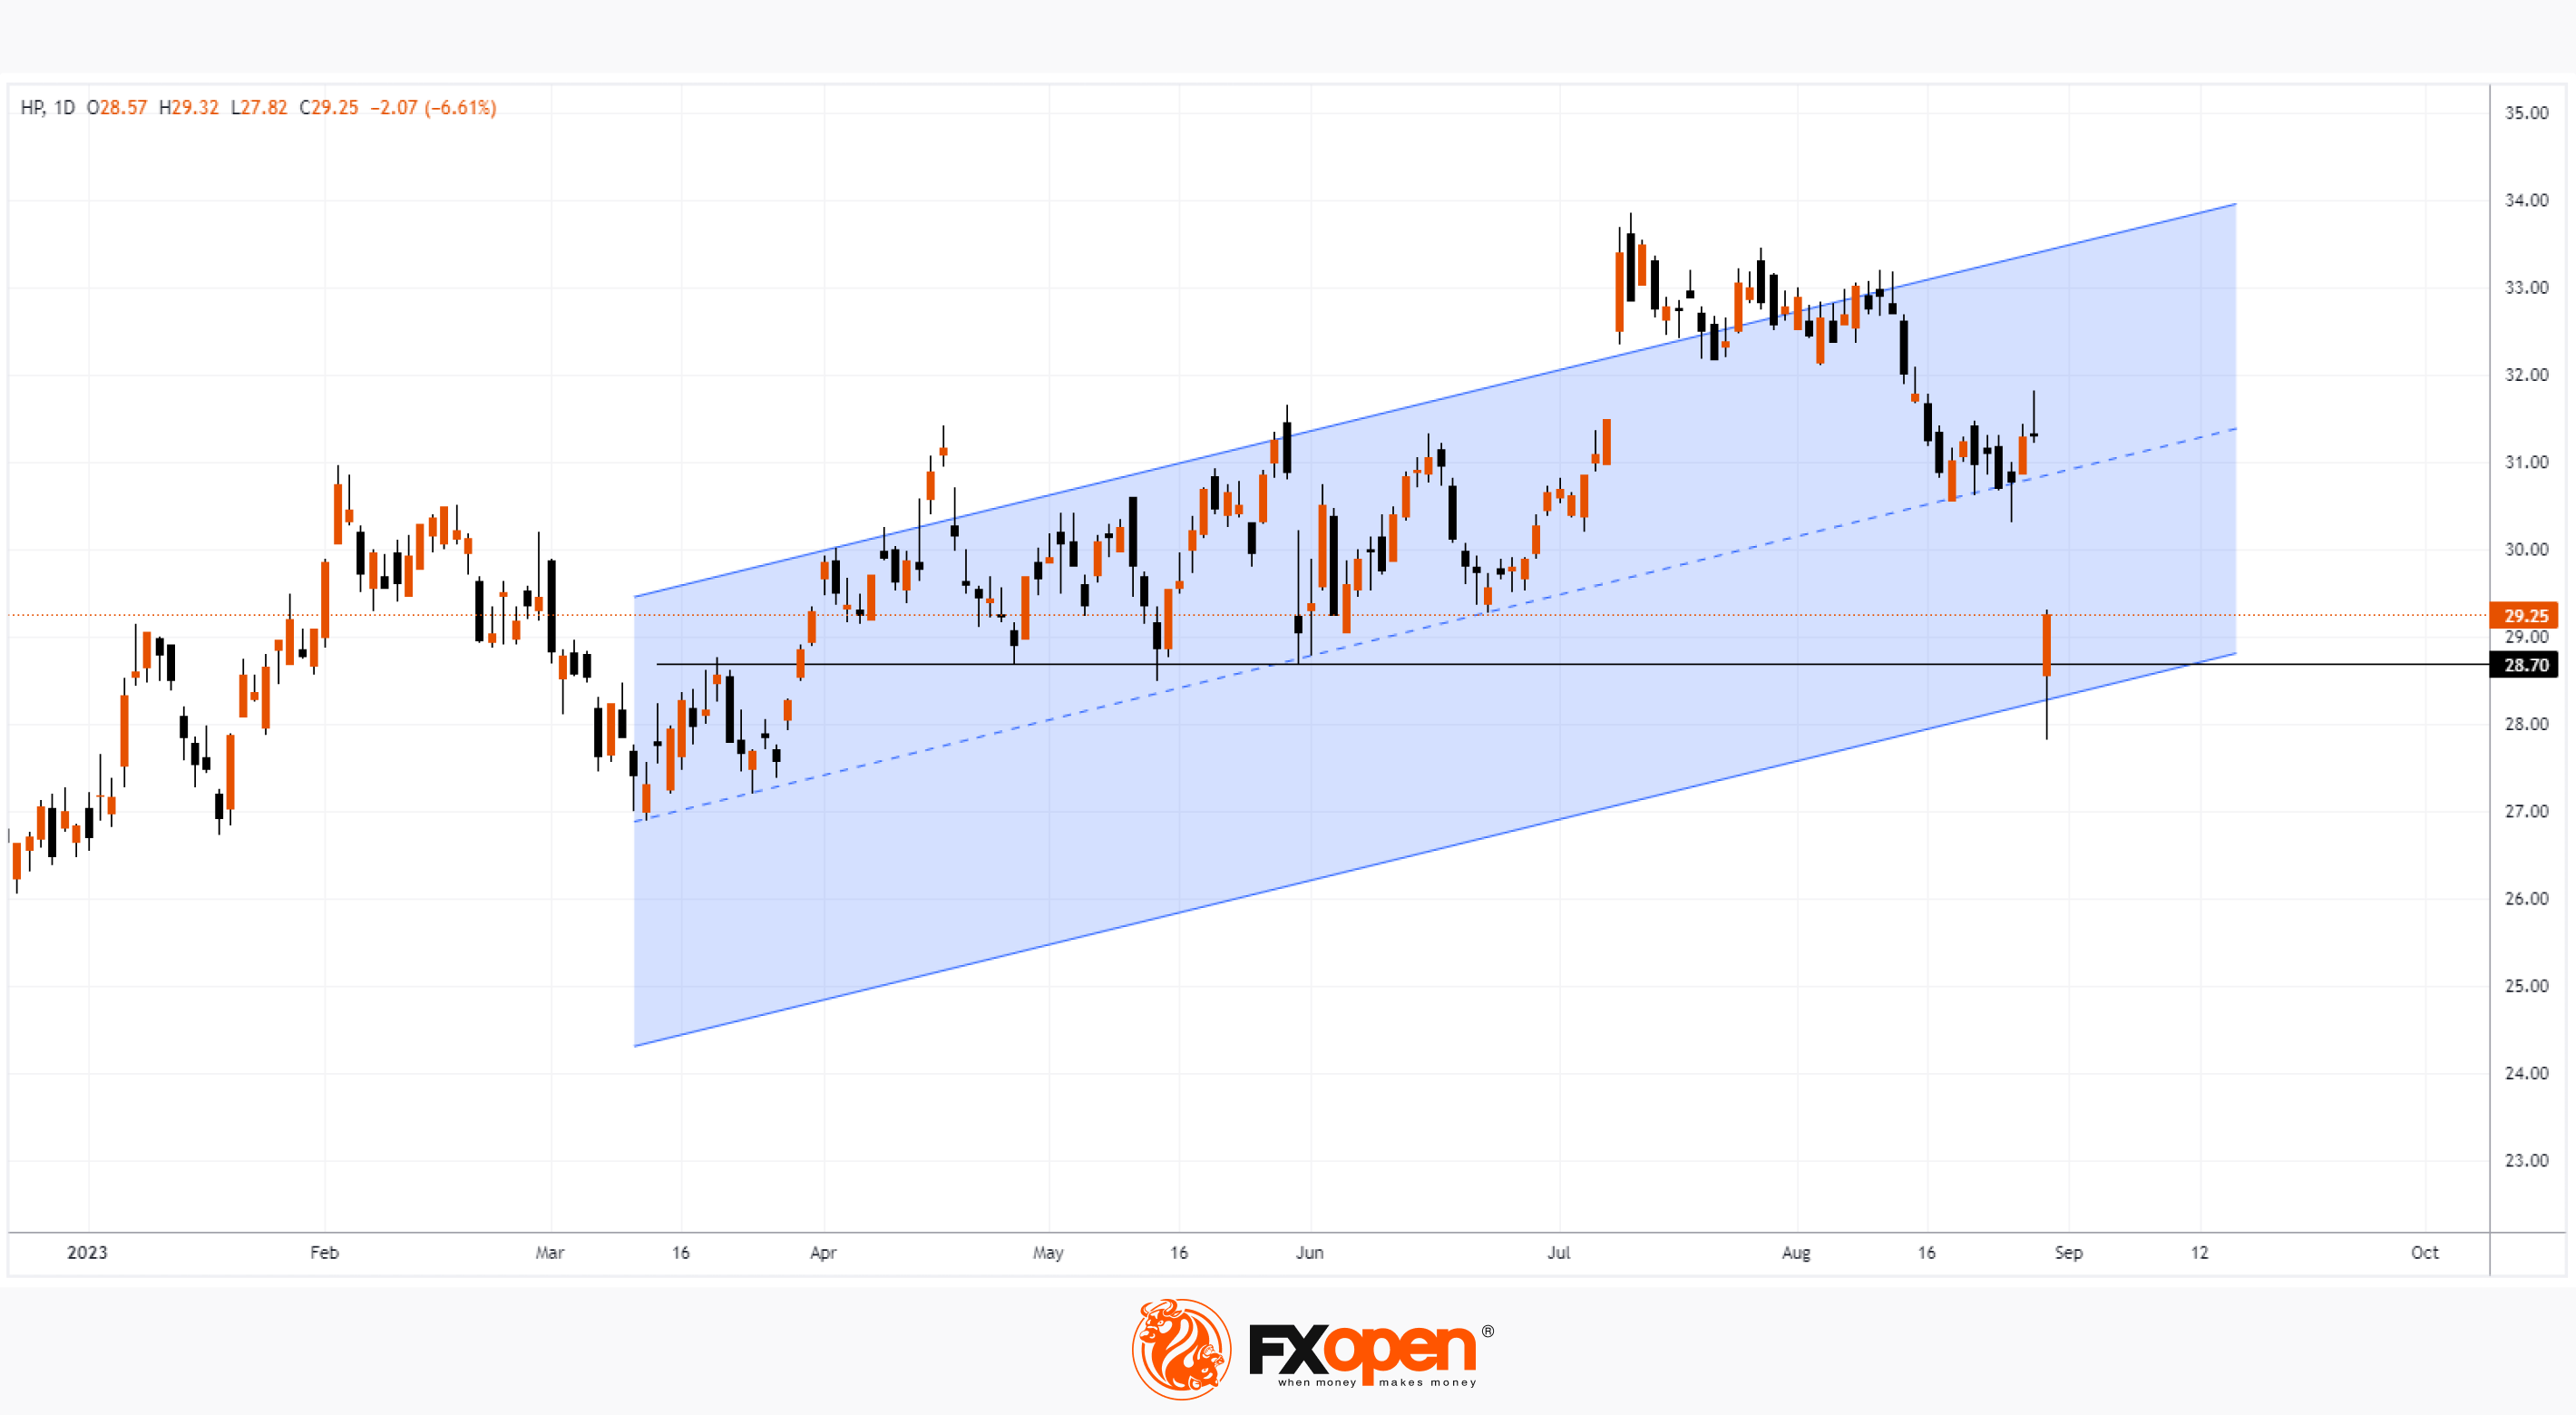
An analysis of the HPQ stock chart makes a strong bullish case:
→ HPQ price closed at the high of the day;
→ the price has found support from the lower boundary of the parallel channel;
→ the price fell below the support at 28.90, but closed above. This may mean that the increased volatility and activation of stop-losses located below the obvious support could be used by large players to accumulate long-term long positions at low prices, which were formed for a short period after the fundamental event.
By the way, according to Lores, the availability of artificial intelligence products at the end of 2024 should refresh consumer and commercial sales.
Buy and sell stocks of the world's biggest publicly-listed companies with CFDs on FXOpen’s trading platform. Open your FXOpen account now or learn more about trading share CFDs with FXOpen.
This article represents the opinion of the Companies operating under the FXOpen brand only. It is not to be construed as an offer, solicitation, or recommendation with respect to products and services provided by the Companies operating under the FXOpen brand, nor is it to be considered financial advice.
Stay ahead of the market!
Subscribe now to our mailing list and receive the latest market news and insights delivered directly to your inbox.


Latest articles

Apple: Earnings Day Above the Activity Zone
On 30 April, after the market close, Apple Inc. will release its financial results for the second quarter of fiscal 2026. The consensus forecast, based on estimates from 31 analysts, points to revenue of around $109.7 billion, with expected

USD/JPY and USD/CHF Near Key Levels: The Dollar Supported by the Fed
The US dollar continues to trend upwards following the Federal Reserve meeting, drawing support from the regulator’s moderately hawkish stance and comments by Jerome Powell. Markets interpret the Fed’s rhetoric as a signal that restrictive policy is likely

EUR/USD and GBP/USD consolidate ahead of the Fed decision
European currencies are showing subdued dynamics, entering a consolidation phase following their previous advance. Earlier, EUR/USD and GBP/USD broke out of their ranges and strengthened; however, the subsequent correction has led both pairs to retest the previously breached