


Market Analysis: Stocks Are Falling on the Background of the Activity of Central Banks
FXOpen
This week could be the worst for stock markets in 3 months after a series of interest rate hikes by central banks, writes Bloomberg.
The UK and Switzerland raised the rate by 0.25%. While the US Fed has left rates unchanged for now, Jerome Powell said another rate hike or two may be needed in 2023. Higher-than-expected inflation in Japan has also fueled speculation that the BOJ may adjust its super-loose monetary policy.
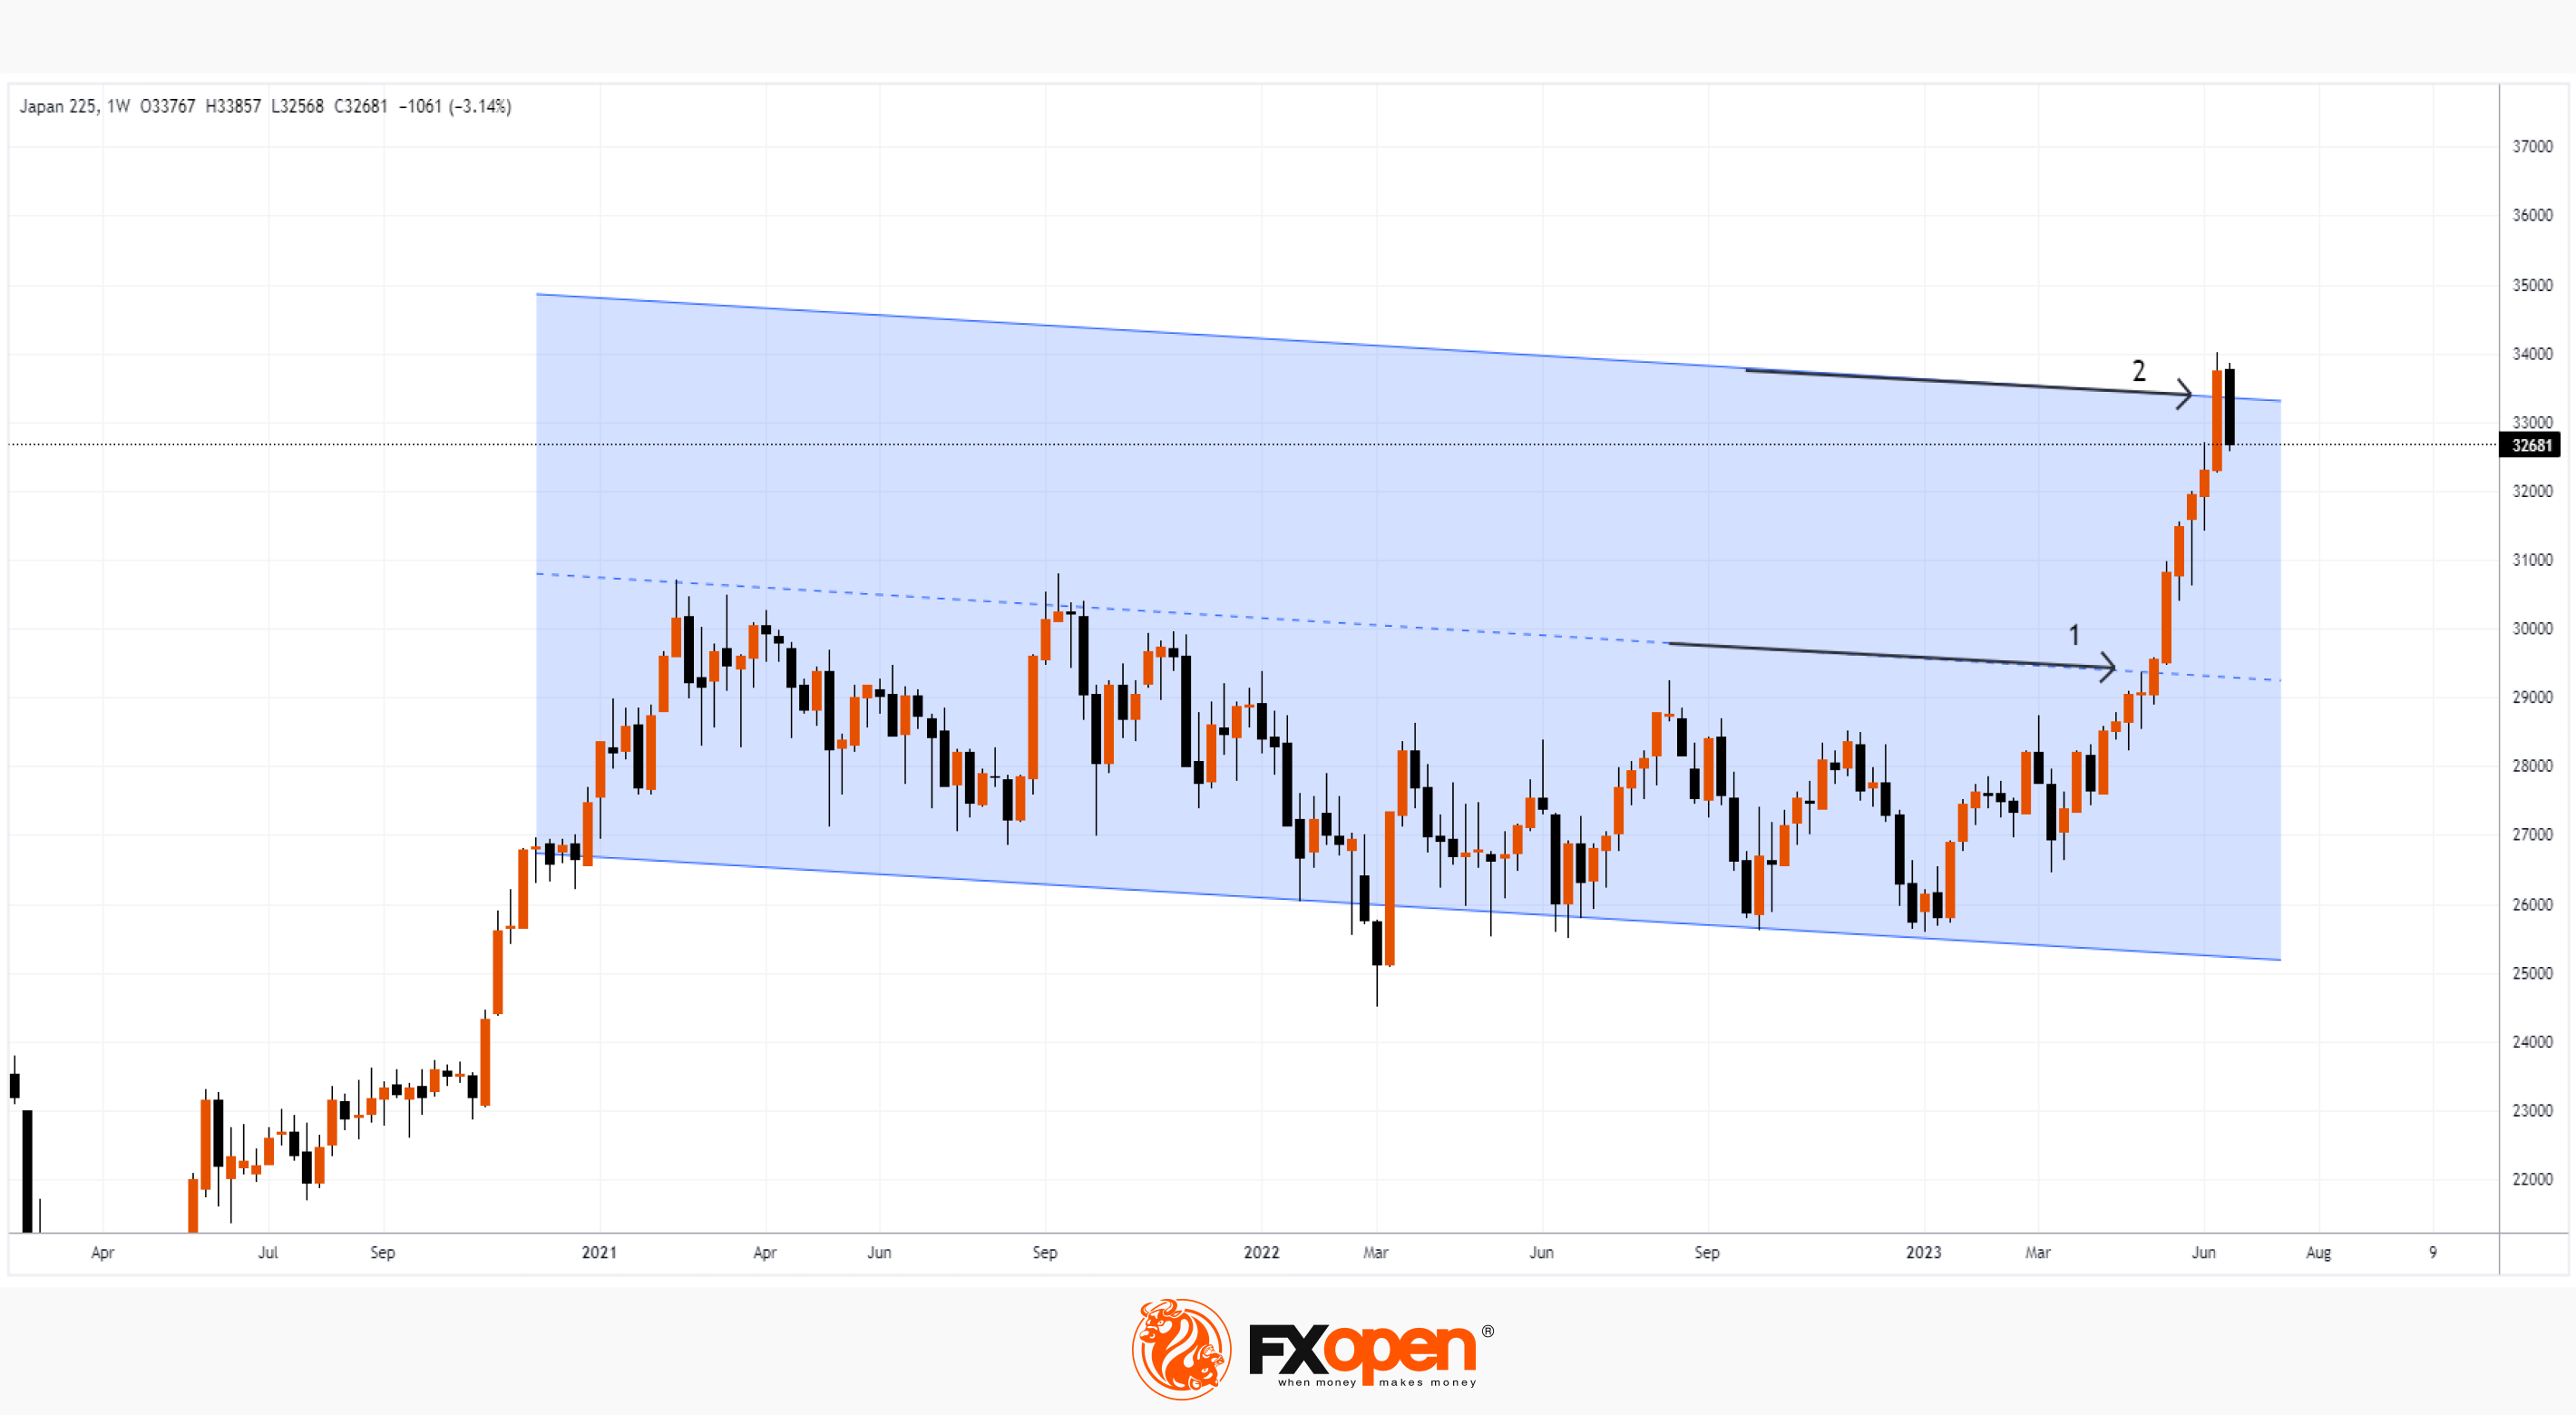
At the same time, an interesting situation is emerging on the Nikkei 225 chart. Having broken through the resistance line (1) in May, the Japanese stock index rushed up, attracting bullish speculators. Growth last week was particularly rapid, suggesting that the market is in the climax of the upward momentum. And the downward movement this week confirms this assumption. A bearish engulfing pattern may form on the Nikkei 225 chart, and, remarkably, if this happens, it will be at the border (2) of a large parallel channel, which begins in the first month of 2021. Thus, the area around 33,000 shows its strength as a resistance and can be used by the bears to build their trading campaigns.
Buy and sell stocks of the world's biggest publicly-listed companies with CFDs on FXOpen’s trading platform. Open your FXOpen account now or learn more about trading share CFDs with FXOpen.
Trade global index CFDs with zero commission and tight spreads (additional fees may apply). Open your FXOpen account now or learn more about trading index CFDs with FXOpen.
This article represents the opinion of the Companies operating under the FXOpen brand only. It is not to be construed as an offer, solicitation, or recommendation with respect to products and services provided by the Companies operating under the FXOpen brand, nor is it to be considered financial advice.
Stay ahead of the market!
Subscribe now to our mailing list and receive the latest market news and insights delivered directly to your inbox.


Latest articles

AUD/CAD: Months of Indecision — Is a Breakout Finally Coming?
The Australian dollar has clawed back most of its end-of-June losses, when it touched three-month lows against the greenback amid escalating Middle East tensions. Since then, sentiment has improved: the RBA's Assistant Governor Sarah Hunter signalled the board stands ready

USD/JPY: Battling at the Top of the Triangle
On 3 July, Japan's Finance Minister, Satsuki Katayama, stated that the Ministry of Finance remains in close contact with US authorities regarding developments in USD/JPY as the yen traded near its weakest level in almost 40 years. Similar verbal

Dow Jones (DJIA): Consolidation Beyond the Trend
Federal Reserve Chair Kevin Warsh testified before Congress on 14–15 July, reaffirming the Fed's commitment to bringing inflation back to target while providing no clear guidance on the future path of interest rates. Meanwhile, June inflation data came in