


FXOpen

Since the beginning of the month, the price of Brent crude oil has risen by about 10% — this July could be the best month since June 2022. Yesterday, the price of Brent exceeded USD 82, for the first time since April.
Among the drivers of oil price growth may be:
- production cuts by Saudi Arabia;
- restriction of export from the Russian Federation;
- expectations of new measures to stimulate the Chinese economy;
- summer growth in demand for gasoline and aviation fuel in the US.
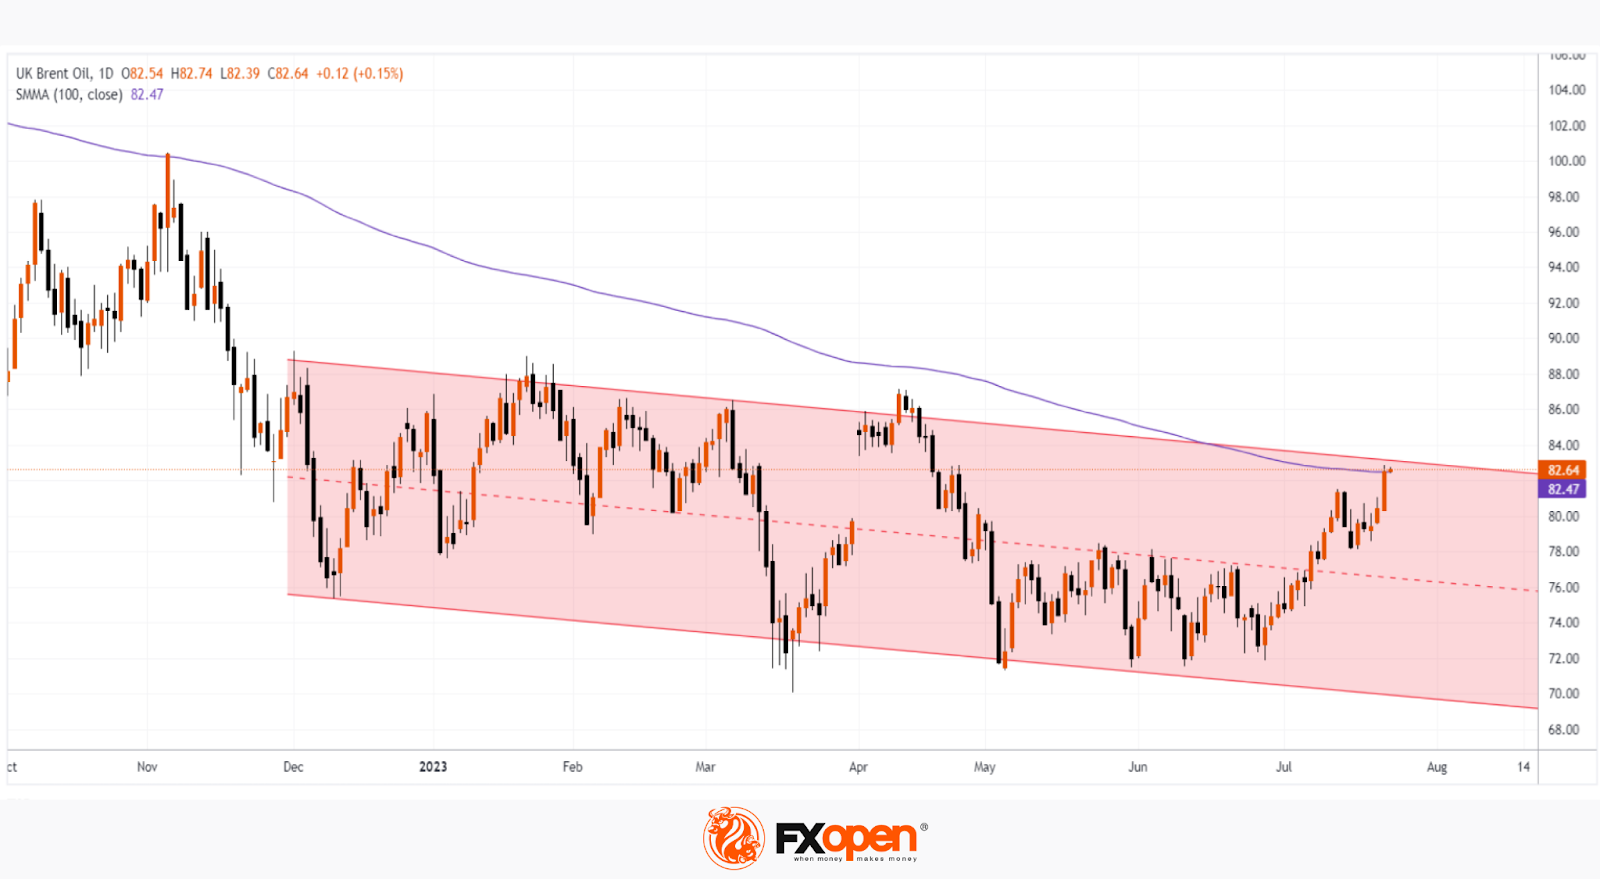
However, technical analysis tools give arguments to suggest that the July rally may slow down, as:
- the price of Brent oil on the daily chart has reached the moving average with a period of 100, which may attract traders to open short positions;
- the price of Brent oil has reached the upper limit of the channel (shown in red).
The effect of these two factors of resistance may appear as early as tomorrow at 17:30 GMT+3, when the weekly data on oil inventories in the US will be published.
Start trading commodity CFDs with tight spreads (additional fees may apply). Open your trading account now or learn more about trading commodity CFDs with FXOpen.
This article represents the opinion of the Companies operating under the FXOpen brand only. It is not to be construed as an offer, solicitation, or recommendation with respect to products and services provided by the Companies operating under the FXOpen brand, nor is it to be considered financial advice.
Stay ahead of the market!
Subscribe now to our mailing list and receive the latest market news and insights delivered directly to your inbox.


Latest articles

USD/CAD Rises to a Two-Month High
Today, the USD/CAD currency pair climbed above the 1.3787 level for the first time since late January.
→ Demand for the US dollar is being supported by concerns over escalating tensions in the Middle East. Market participants are favouring

Alphabet (GOOGL) Shares Fall to 2026 Low
As the chart shows, Alphabet (GOOGL) shares have dropped to their lowest level of 2026, with trading closing well below the psychological $300 per share mark.
Why Have Alphabet (GOOGL) Shares Declined?
The bearish move is driven by a combination

FX Market Awaits Macro Data: EUR/USD and GBP/USD Near Range Boundaries
European currencies are trading without a clear direction against the US dollar, remaining in a consolidation phase following the earlier decline driven by USD strength. At the start of the week, both EUR/USD and GBP/USD attempted a recovery,