


FXOpen

Back on August 21, gold was trading below USD 1,890 an ounce, but to date, its price has risen by about 3%. This was helped by published data on the number of vacancies in the US, which fell to the lowest level in almost 2.5 years in July. This and other signals of a slowdown in the US economy may influence the Fed's decision to continue raising interest rates further, which weakens the US dollar and supports the price of gold.
Bullish arguments:
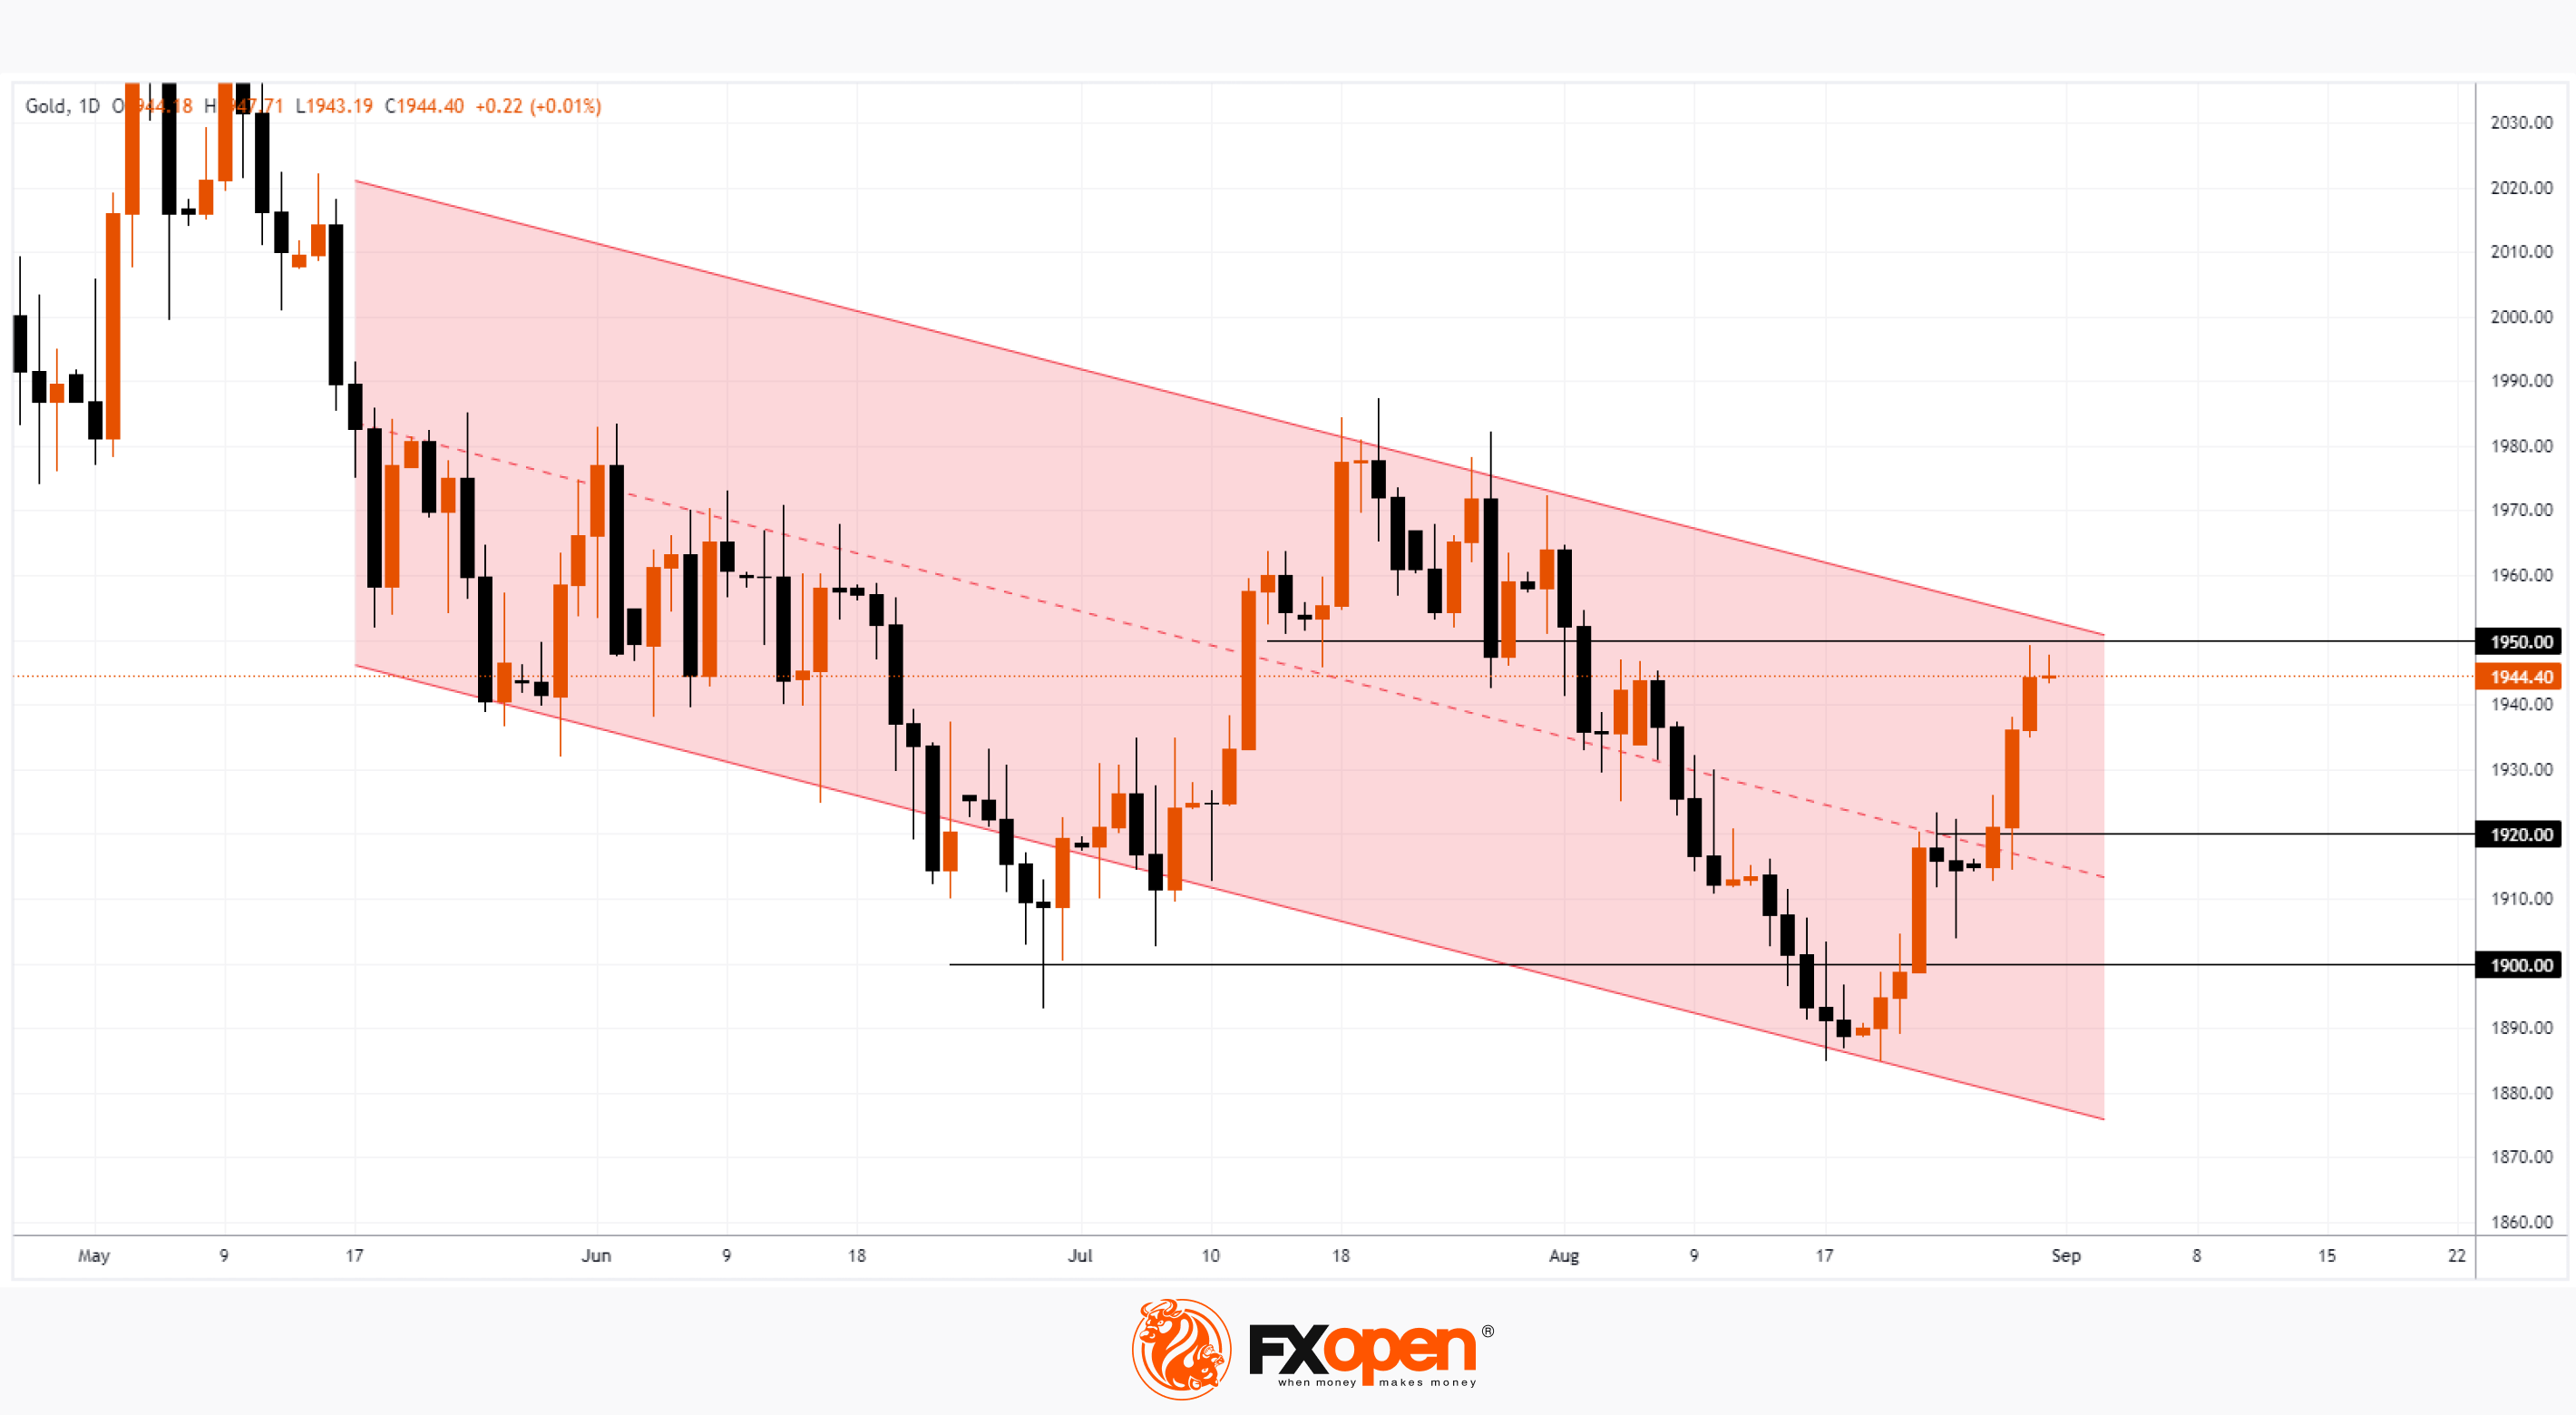
→ the psychological barrier of USD 1,900 serves as an important support. The price of gold was there for only a few days, after which a steady increase followed.
→ The USD 1,920 resistance level was taken under control by the bulls after the breakdown on August 28-29. Now we can expect that there will be support here.
→ If a moderate decline on low volumes follows in the coming days, this will be a sign of a normal correction in a bull market
Bearish arguments:
→ Expect resistance from USD 1,950. It is possible that if an attack follows it, it will turn into a false breakdown.
→ Gold is within a descending channel (shown in red) and its upside price may be resisting gold's uptrend.
Be prepared for a surge in volatility today at 15:30 GMT+3, at which time Personal Consumption Expenditure (PCE) and monthly employment figures are released, important indicators of the economy in terms of impact on US interest rates.
Start trading commodity CFDs with tight spreads (additional fees may apply). Open your trading account now or learn more about trading commodity CFDs with FXOpen.
This article represents the opinion of the Companies operating under the FXOpen brand only. It is not to be construed as an offer, solicitation, or recommendation with respect to products and services provided by the Companies operating under the FXOpen brand, nor is it to be considered financial advice.
Stay ahead of the market!
Subscribe now to our mailing list and receive the latest market news and insights delivered directly to your inbox.


Latest articles

USD/CAD Rises to a Two-Month High
Today, the USD/CAD currency pair climbed above the 1.3787 level for the first time since late January.
→ Demand for the US dollar is being supported by concerns over escalating tensions in the Middle East. Market participants are favouring

Alphabet (GOOGL) Shares Fall to 2026 Low
As the chart shows, Alphabet (GOOGL) shares have dropped to their lowest level of 2026, with trading closing well below the psychological $300 per share mark.
Why Have Alphabet (GOOGL) Shares Declined?
The bearish move is driven by a combination

FX Market Awaits Macro Data: EUR/USD and GBP/USD Near Range Boundaries
European currencies are trading without a clear direction against the US dollar, remaining in a consolidation phase following the earlier decline driven by USD strength. At the start of the week, both EUR/USD and GBP/USD attempted a recovery,