


FXOpen

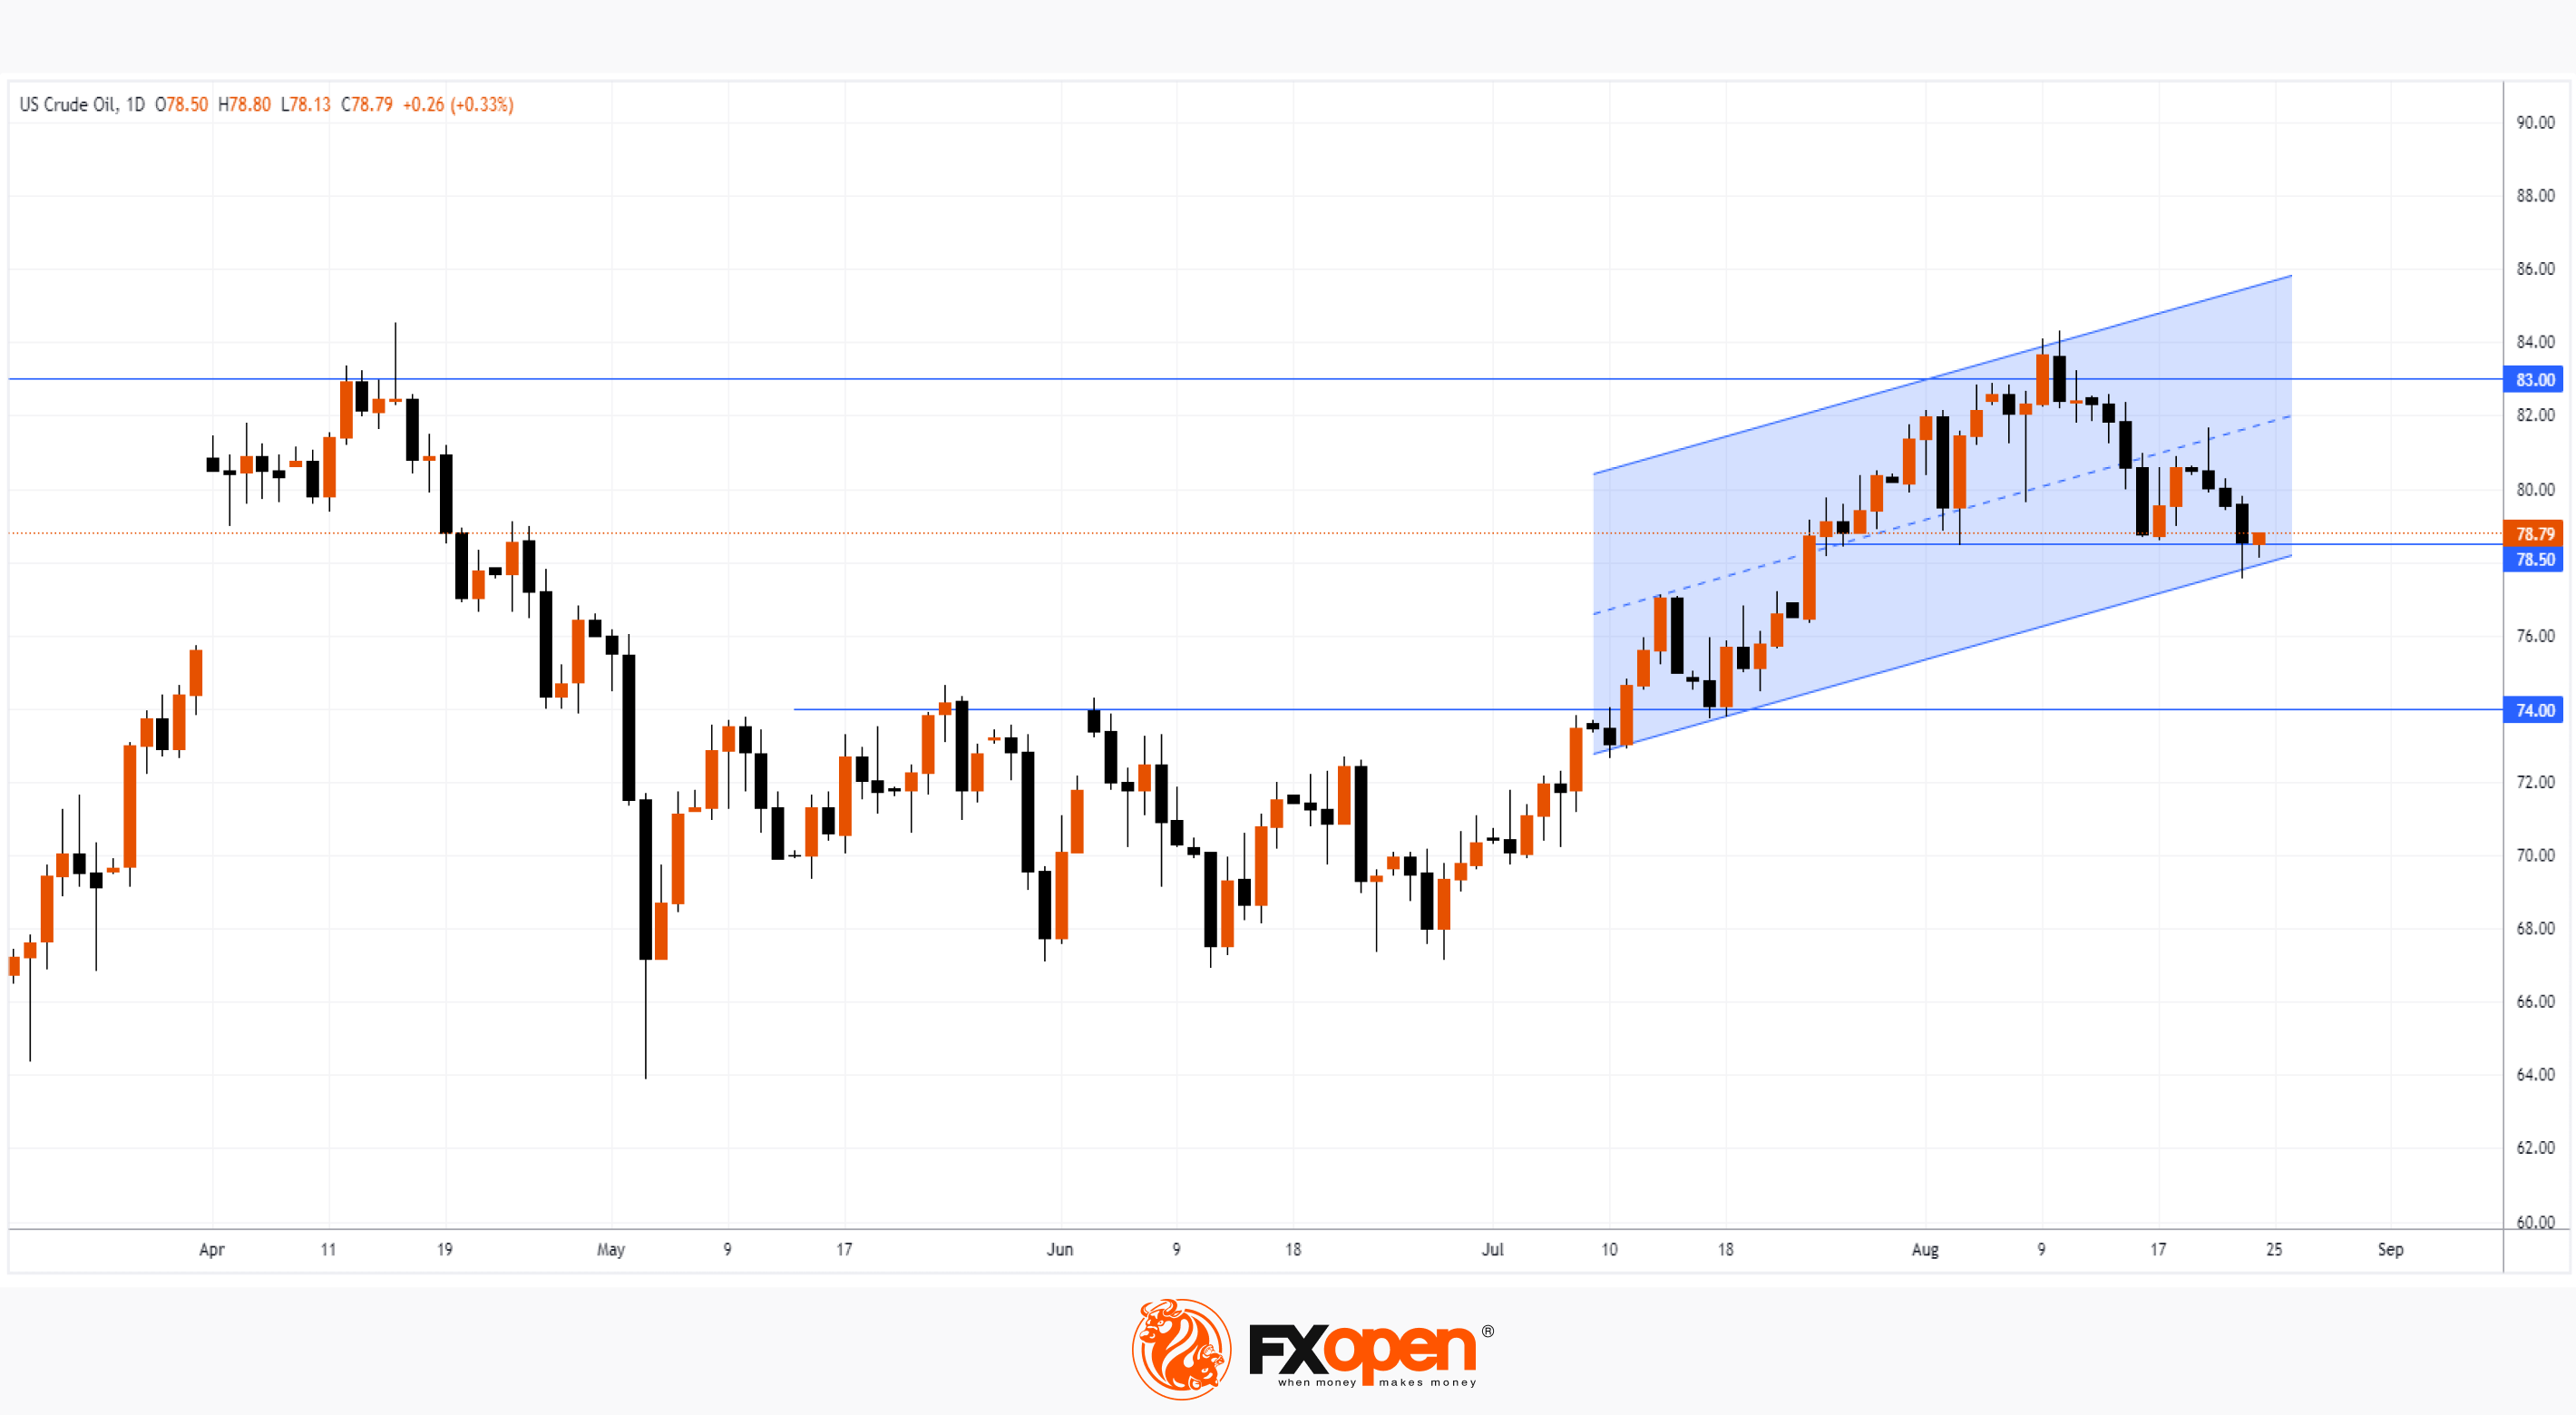
As the chart shows, US Crude Oil fell below USD 78 yesterday for the first time since July 25. This was facilitated by:
→ fears of a crisis that could follow from the collapse of the Chinese property developer Evergrande;
→ alarming PMI data from different economies. Japan reported a contraction in manufacturing activity for the third month in a row. Business activity in the euro area also fell more than expected, especially in Germany. Business activity in the US in August approached the point of stagnation, while growth was the weakest since February.
Bullish arguments:
→ The market has been bullish since July. And the current rollback from the top of July is just a correction.
→ The price of WTI Crude may find support from the lower border of the rising channel, as well as from the level of USD 78.50, from which the price has already formed bullish reversals in August.
→ The level of USD 74 looks like a reliable support.
Bearish arguments:
→ The USD 83 level has served as strong resistance throughout the year. This may be due to the fact that increasing the price above is not beneficial for governments and central banks that are fighting inflation.
→ A candle with a long upper shadow on August 21 (followed by 2 more bearish candles) indicates bearish activity.
Start trading commodity CFDs with tight spreads (additional fees may apply). Open your trading account now or learn more about trading commodity CFDs with FXOpen.
This article represents the opinion of the Companies operating under the FXOpen brand only. It is not to be construed as an offer, solicitation, or recommendation with respect to products and services provided by the Companies operating under the FXOpen brand, nor is it to be considered financial advice.
Stay ahead of the market!
Subscribe now to our mailing list and receive the latest market news and insights delivered directly to your inbox.


Latest articles

USD/CAD Rises to a Two-Month High
Today, the USD/CAD currency pair climbed above the 1.3787 level for the first time since late January.
→ Demand for the US dollar is being supported by concerns over escalating tensions in the Middle East. Market participants are favouring

Alphabet (GOOGL) Shares Fall to 2026 Low
As the chart shows, Alphabet (GOOGL) shares have dropped to their lowest level of 2026, with trading closing well below the psychological $300 per share mark.
Why Have Alphabet (GOOGL) Shares Declined?
The bearish move is driven by a combination

FX Market Awaits Macro Data: EUR/USD and GBP/USD Near Range Boundaries
European currencies are trading without a clear direction against the US dollar, remaining in a consolidation phase following the earlier decline driven by USD strength. At the start of the week, both EUR/USD and GBP/USD attempted a recovery,