


Market Analysis: US Stocks Continue to Rise
FXOpen

After a turbulent week filled with macroeconomic news and decisions of the central bank of the leading economies, on Monday morning futures for the E-mini S&P 500 index look bullish, being near the highs of the year.
The following factors contribute to the positive in the market:
- Friday's data indicating a slowdown in inflation. The Core PCE Price index was 0.2% in monthly terms (expected = 0.3%, last month = 0.3%).
- The probability of a rate hike in September according to FEDWatch is only 20%. The US economy is moving towards a soft landing, according to WSJ analysts.
- Strong reports from a number of companies for the 2nd quarter, including Google. Also, market participants are looking forward to new reports with enthusiasm — news for AAPL, AMZN, AMD and other companies included in the S&P 500 index are scheduled this week.
However, analysts at Bank of America note that the cost of options used to hedge against falling stock prices is at an all-time low — evidence of excessive positivity in the market, which could lead to a correction.
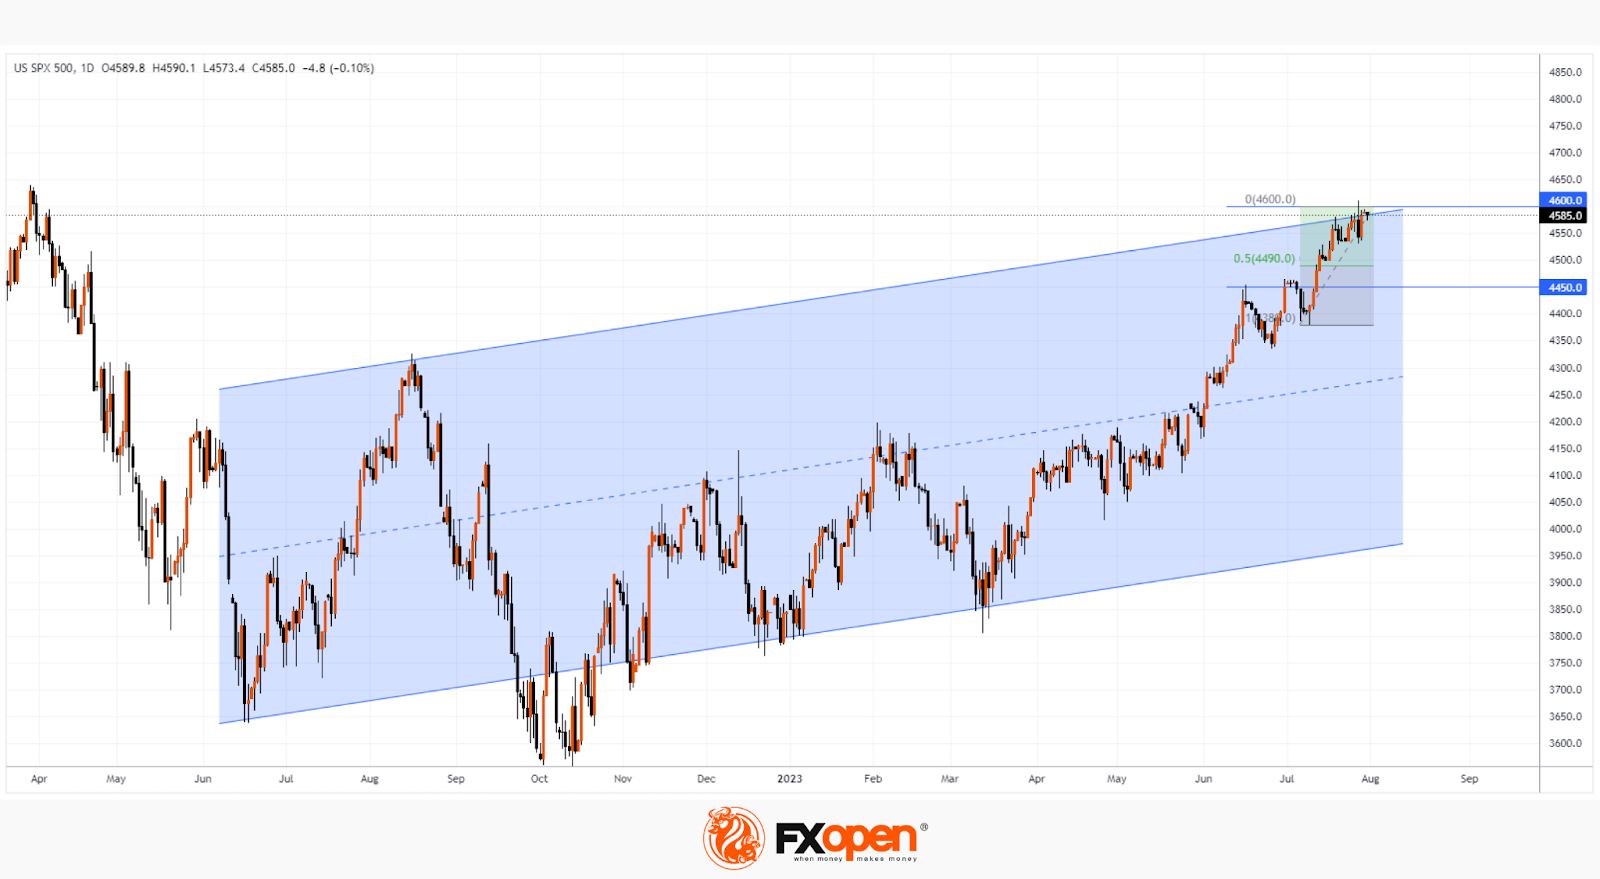
The S&P 500 index chart shows that the price is in a vulnerable position for a pullback, as it is in the resistance area:
- from the psychological level 4,600;
- from the upper border of the ascending channel (shown in blue).
Support levels:
- 4,490 level, which corresponds to approximately 50% of the rally from July lows to its high
- median line of the ascending channel. It seems unattainable, but Bloomberg reminds us that August and September are historically the worst months for stock prices from the S&P 500 index.
Buy and sell stocks of the world's biggest publicly-listed companies with CFDs on FXOpen’s trading platform. Open your FXOpen account now or learn more about trading share CFDs with FXOpen.
This article represents the opinion of the Companies operating under the FXOpen brand only. It is not to be construed as an offer, solicitation, or recommendation with respect to products and services provided by the Companies operating under the FXOpen brand, nor is it to be considered financial advice.
Stay ahead of the market!
Subscribe now to our mailing list and receive the latest market news and insights delivered directly to your inbox.


Latest articles

Amazon Earnings: Does the Chart Already Know Something the Numbers Don't?
All eyes are on July 30, when Amazon reports Q2 2026 earnings, with Wall Street increasingly convinced the bar has been set too low. Consensus sees EPS near $1.82-$2.26 on roughly $197 billion in revenue, but the

WTI Analysis: Gap Breaks Short-Term Trend as Price Remains Trapped Between the POC and Profile Boundary
WTI crude oil plunged by more than 7% on 27 July 2026 after the US suspended a series of strikes against Iran over the weekend, raising hopes of a diplomatic solution and the reopening of shipping through the Strait of

US Dollar Index: A Defining Week for the King of the Markets
The dollar heads into a pivotal week trading near 101.80, just off a 15-month high, with the Fed's July 29 meeting standing as the clear focal point. Markets currently price roughly a 65% chance of a hold, though renewed