


Market Analysis: USD/JPY and NIKKEI React to Bank of Japan Decision
FXOpen

This morning, the Bank of Japan decided to leave interest rates unchanged at -0.10%. Its head, Kazuo Ueda, stated that:
→ the chances that the current ultra-loose monetary policy will change in January are very small;
→ further decisions of the Bank of Japan will be based on incoming economic information.
Thus, rumors that the Bank of Japan might raise rates from the negative zone did not come true. As a result, the NIKKEI index rose to November highs, and the yen weakened.
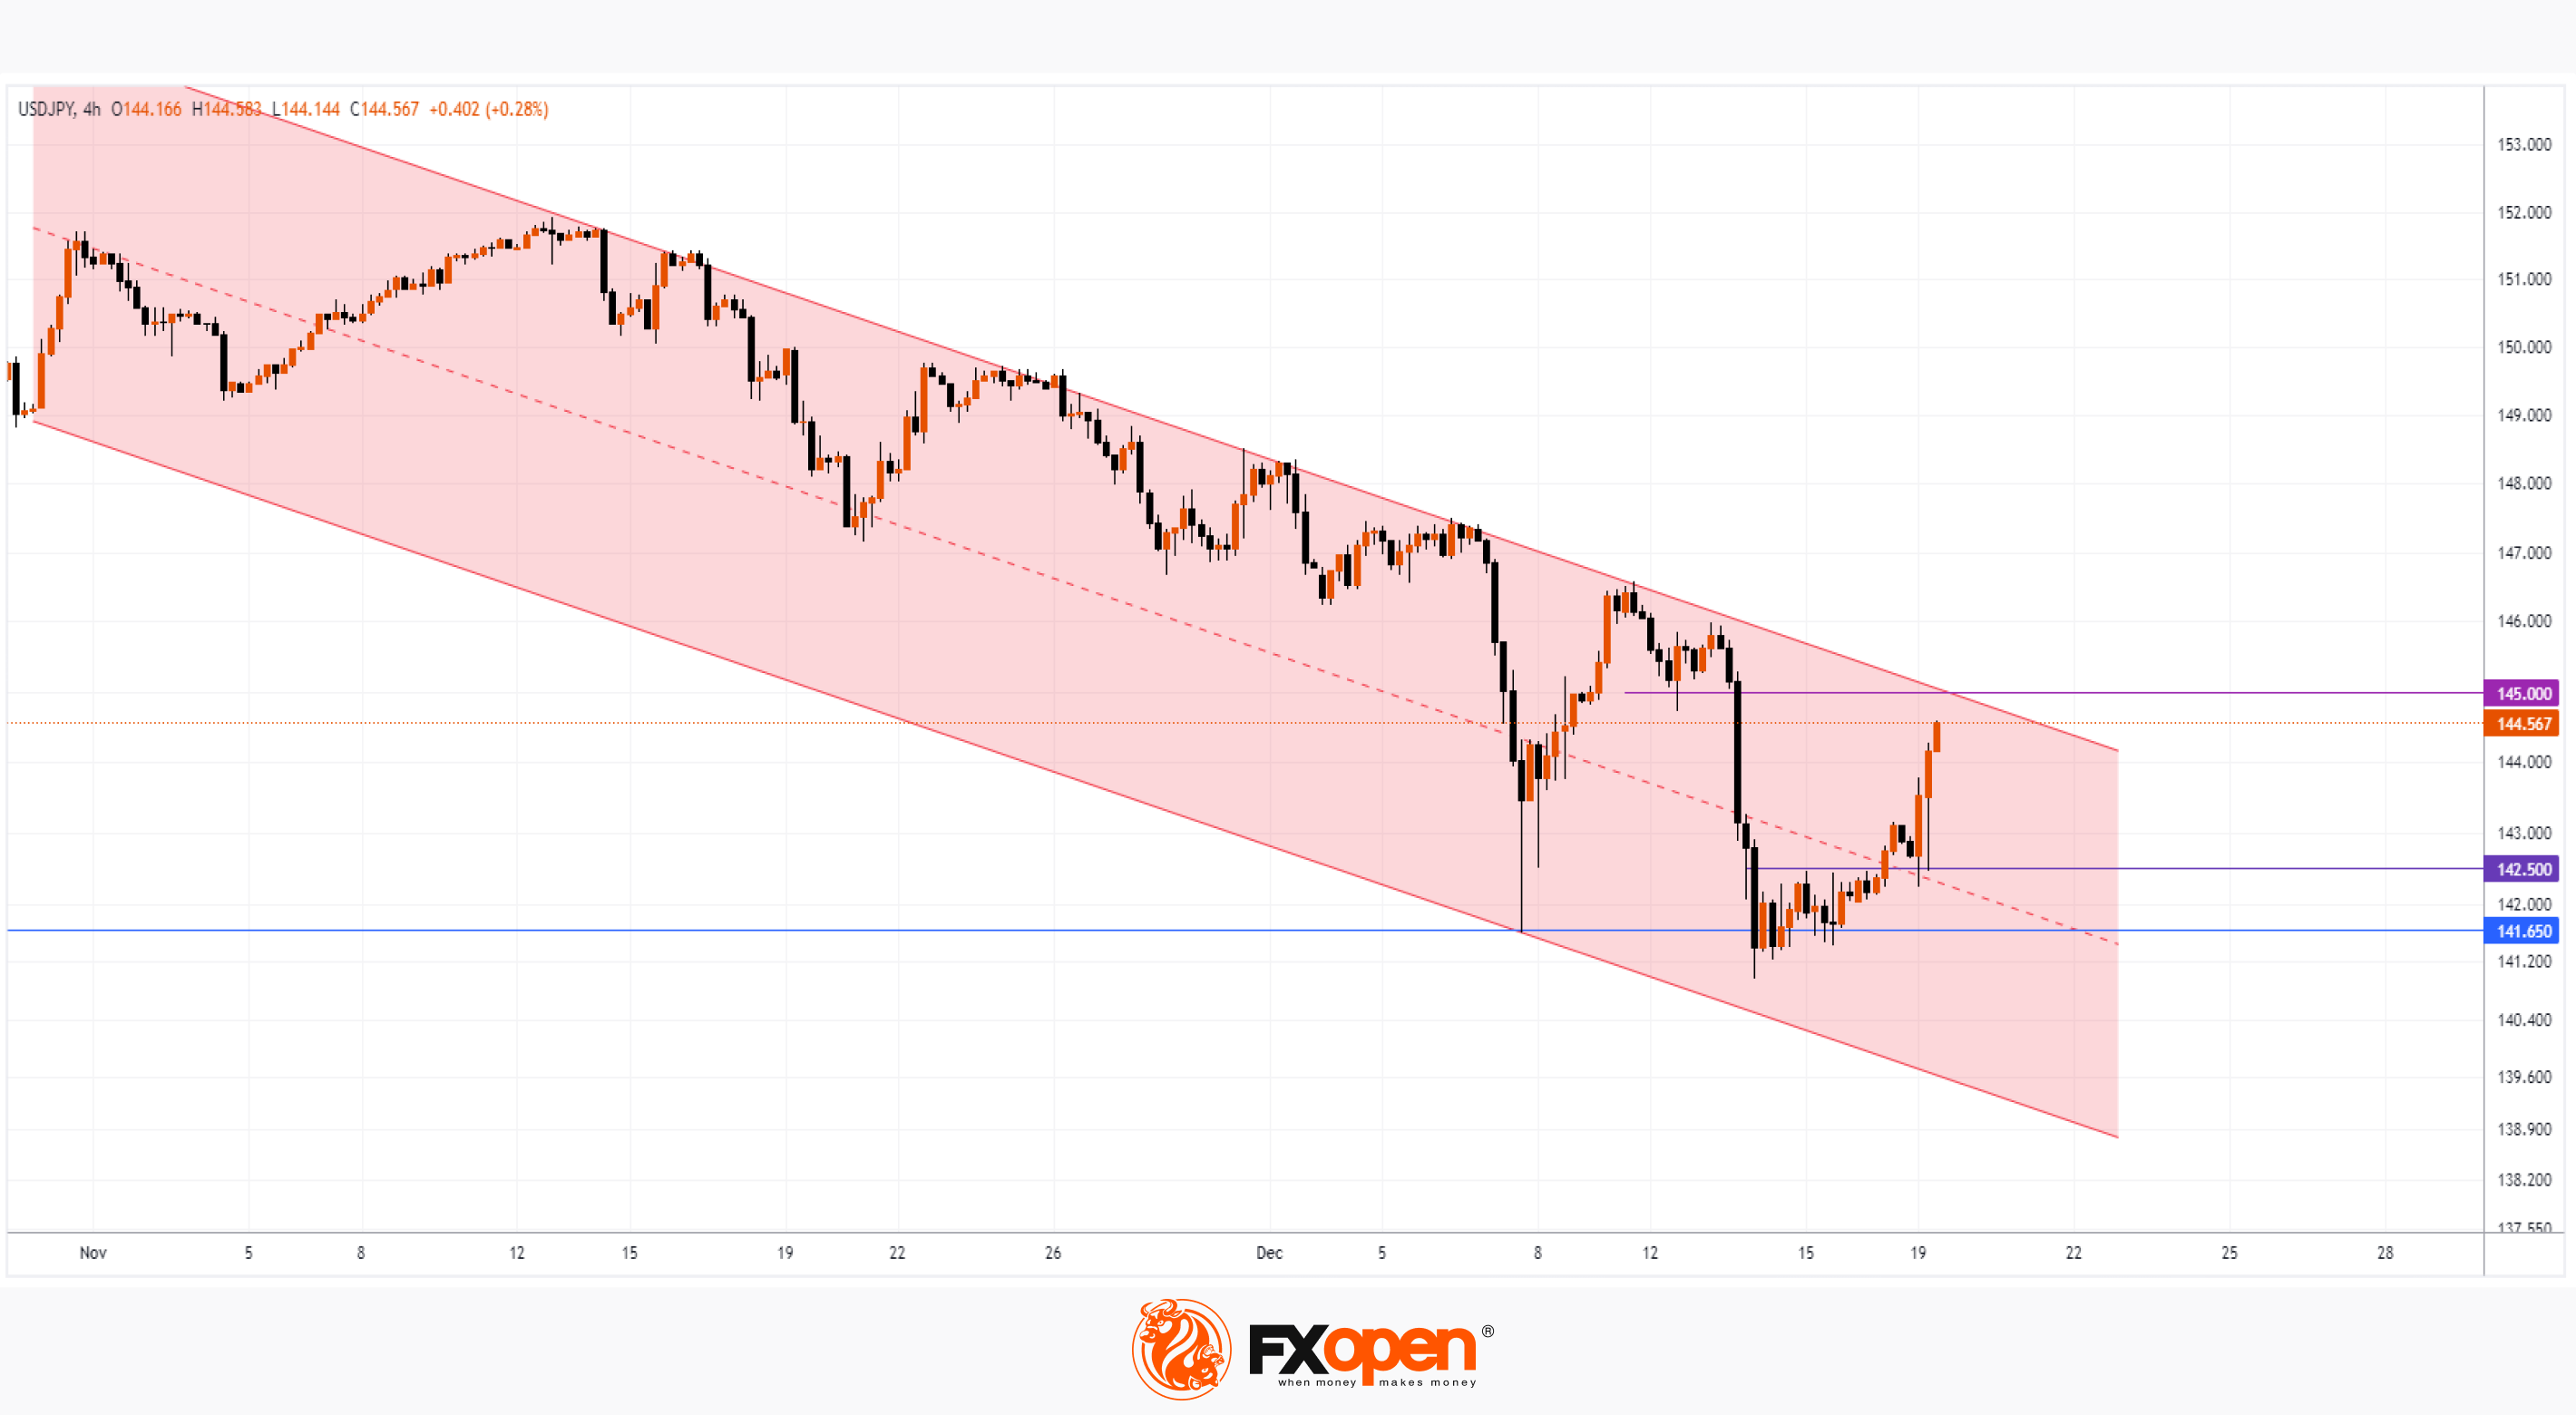
The 4 hour USD/JPY chart shows that:
→ The price forms a downward channel (shown in red). The strengthening of the yen against the US dollar, observed since November, was caused by both rumors related to the Bank of Japan and the prospect of a rate cut by the Federal Reserve.
→ The lower border of the channel pushed the price upward on December 7, indicating support at 141.65.
→ On December 14, there was an attempt at a bearish breakdown of this support. But instead of developing a downward movement to another touch with the lower border of the channel, the price entered into consolidation (an early bullish sign), which lasted until the end of last week and marked the resistance level of 142.5.
→ The closer the Bank of Japan's decision was, the stronger the bulls became. After breaking through the level of 142.5, it was tested. Moreover, not only the level of 142.5, but also the median line of the channel showed its support role.
The upward momentum that the USD/JPY market has received may develop during today's American session. It is possible that the quote will reach resistance at 145 yen per dollar, which is strengthened by the upper boundary of the downward channel.
Trade over 50 forex markets 24 hours a day with FXOpen. Take advantage of low commissions, deep liquidity, and spreads from 0.0 pips (additional fees may apply). Open your FXOpen account now or learn more about trading forex with FXOpen.
This article represents the opinion of the Companies operating under the FXOpen brand only. It is not to be construed as an offer, solicitation, or recommendation with respect to products and services provided by the Companies operating under the FXOpen brand, nor is it to be considered financial advice.
Stay ahead of the market!
Subscribe now to our mailing list and receive the latest market news and insights delivered directly to your inbox.


Latest articles

Amazon Earnings: Does the Chart Already Know Something the Numbers Don't?
All eyes are on July 30, when Amazon reports Q2 2026 earnings, with Wall Street increasingly convinced the bar has been set too low. Consensus sees EPS near $1.82-$2.26 on roughly $197 billion in revenue, but the

WTI Analysis: Gap Breaks Short-Term Trend as Price Remains Trapped Between the POC and Profile Boundary
WTI crude oil plunged by more than 7% on 27 July 2026 after the US suspended a series of strikes against Iran over the weekend, raising hopes of a diplomatic solution and the reopening of shipping through the Strait of

US Dollar Index: A Defining Week for the King of the Markets
The dollar heads into a pivotal week trading near 101.80, just off a 15-month high, with the Fed's July 29 meeting standing as the clear focal point. Markets currently price roughly a 65% chance of a hold, though renewed