


Market Analysis: USD/JPY Rate Updates the High of the Year
FXOpen

Yesterday, USD/JPY hit 146.74 for the first time since November 2022. The rise in the rate is facilitated by the growing gap in the policies of central banks: while the Bank of Japan has kept the rate below zero since 2016, the Fed has been raising rates since the spring of 2022.
Moreover, on Friday, Powell said the Fed is ready to continue to remain tough in the fight against inflation. According to CME's FedWatch tool, there is now a 62% chance of a rate hike at the Fed's November meeting, up from 42% a week earlier.
However, the limiting factor for the USD/JPY rate is the power of the Japanese Ministry of Finance. Last year, when the market was at current levels, the authorities intervened in the foreign exchange market, lowering the rate to 140 yen per US dollar.
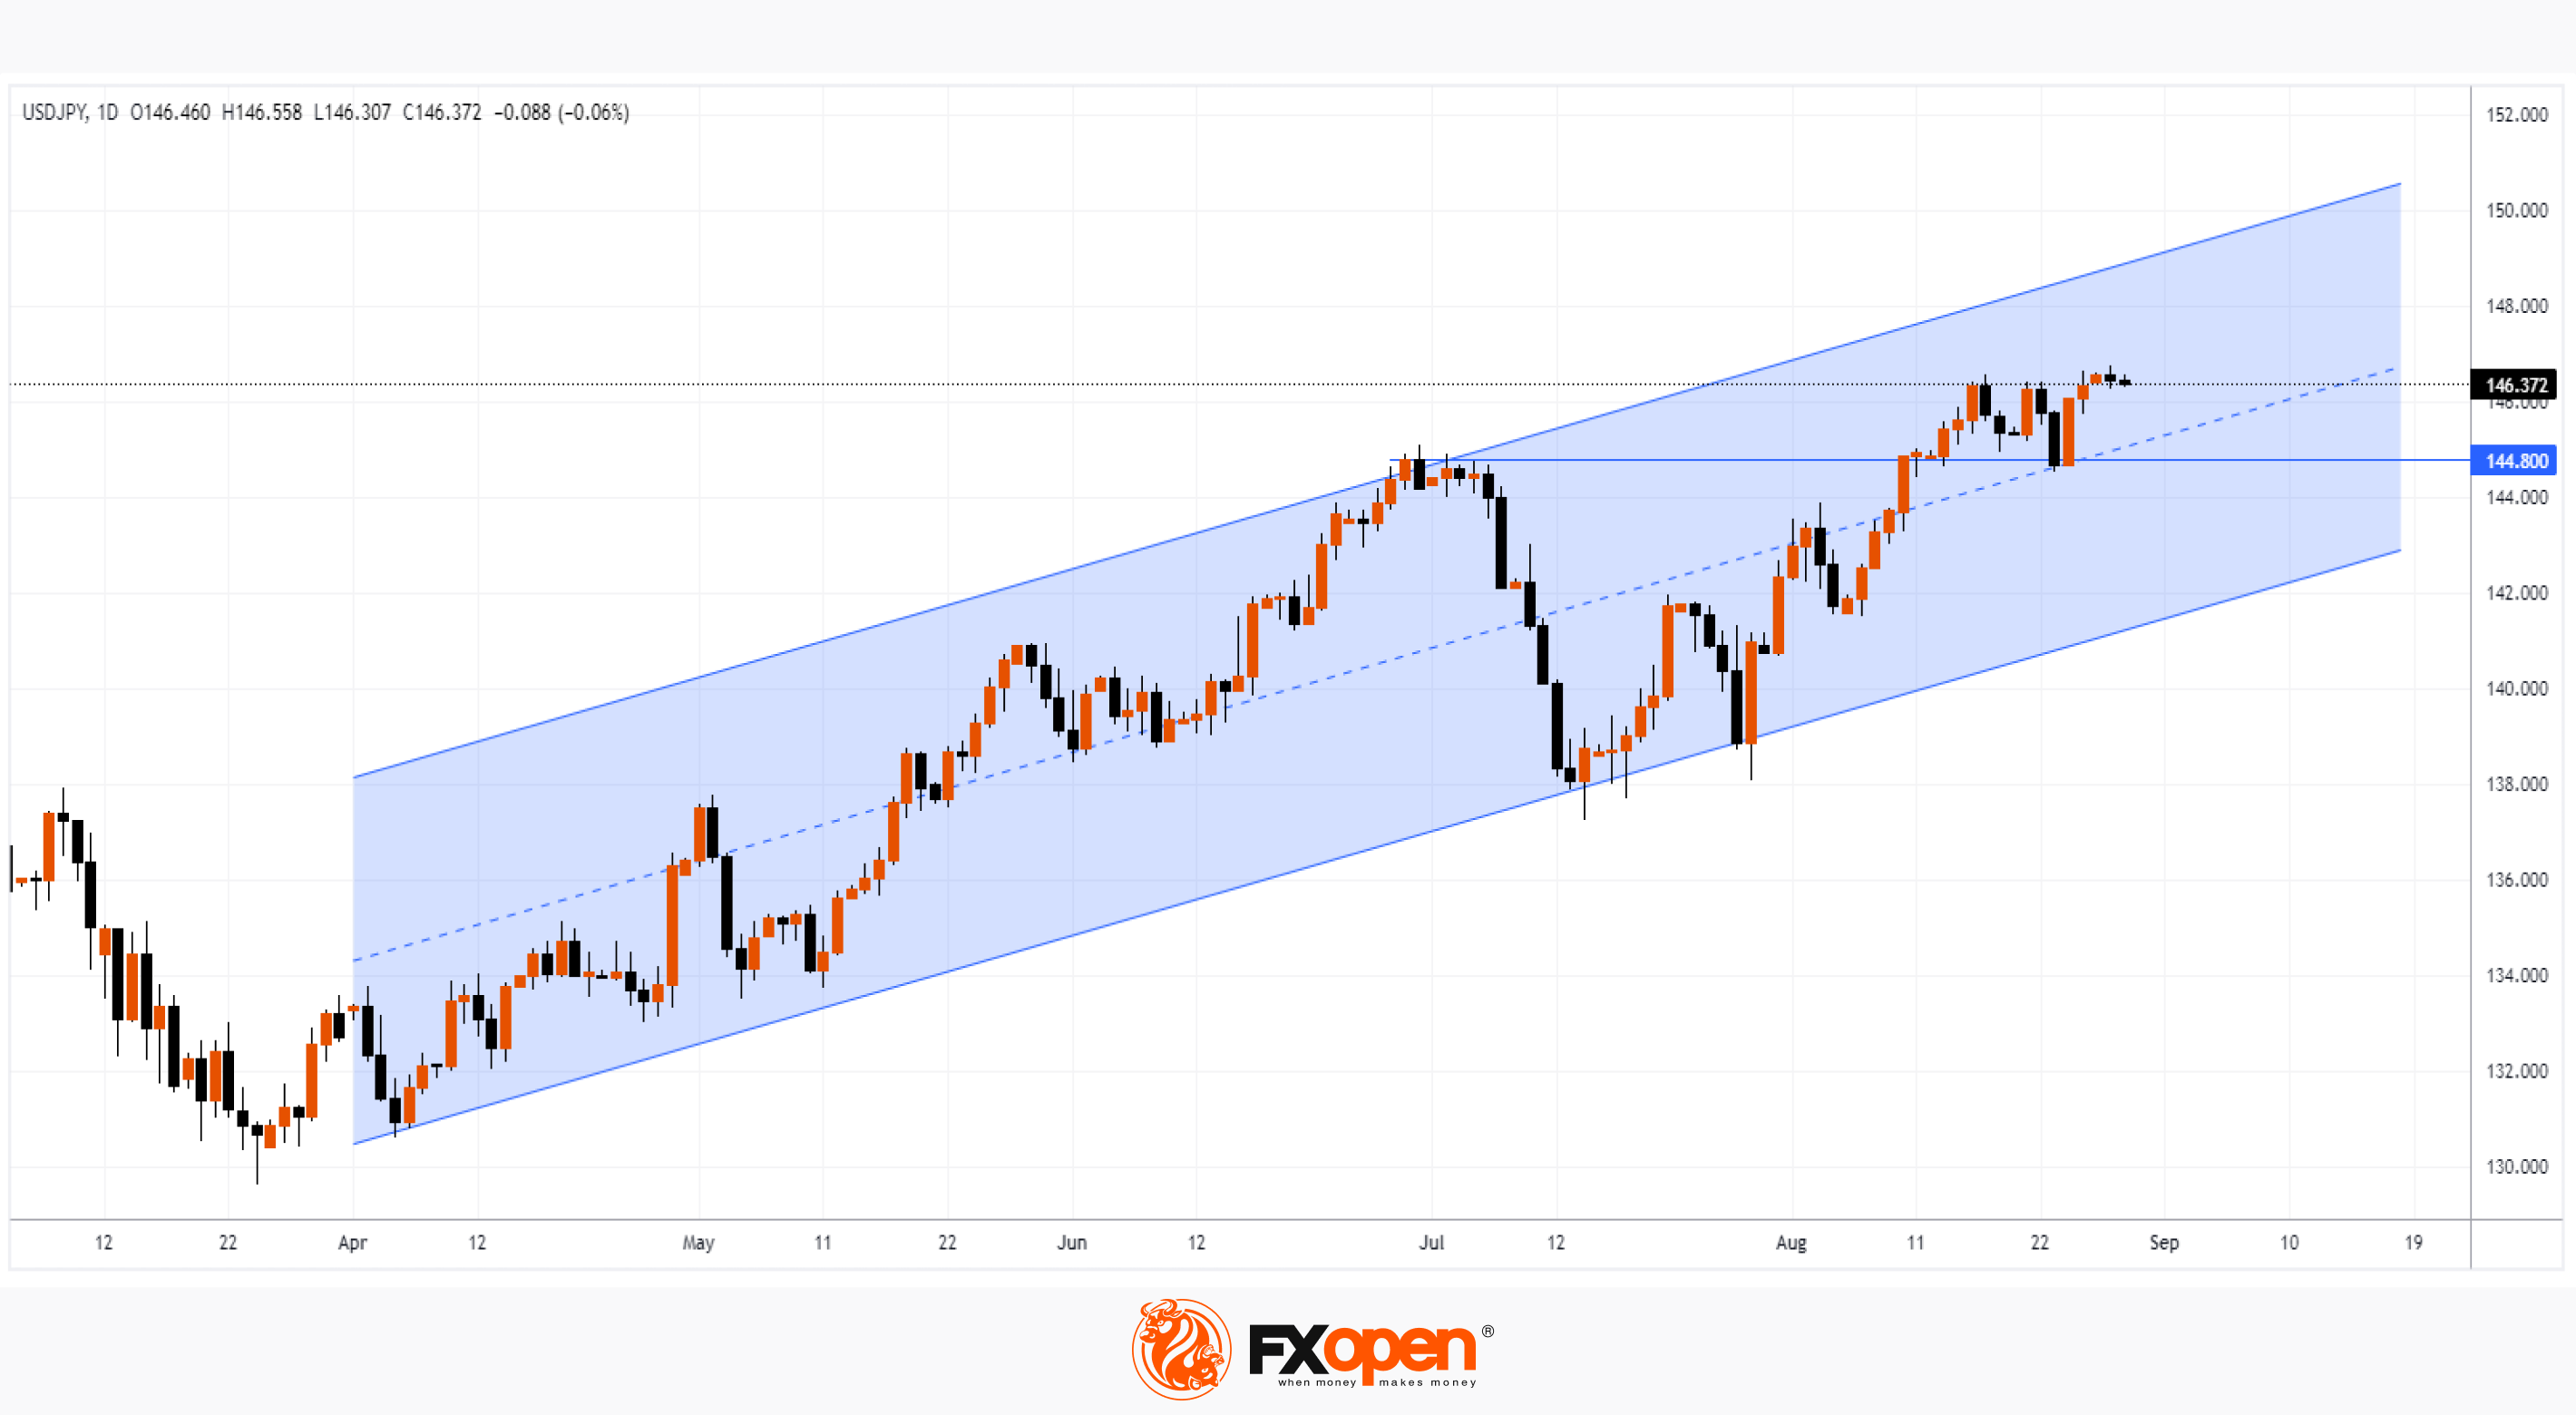
The USD/JPY chart shows that:
→ the price continues to move within the ascending channel;
→ on Friday, during Powell's speech, the median line was tested, confirming its influence as a support;
→ former resistance at 144.8 also provides support;
→ if the trend continues, the rate may reach the upper limit of the channel — that is, the psychological mark of 150 yen per US dollar.
However, if we analyze the progress of the bulls when reaching the tops, then we can assume that the bullish momentum is depleted: after all, bullish candles do not have a wide body when they reach the highs, but on the contrary, they shrink. For sure, the strength of buyers is limited by fears of new interventions. Therefore, it is possible that a series of cautious renewal of the highs of the year may be interrupted when the Japanese authorities have their say.
According to analysts at Goldman Sachs, the yen may weaken to 155 per US dollar if the Bank of Japan continues to adhere to its ultra-soft position.
Trade over 50 forex markets 24 hours a day with FXOpen. Take advantage of low commissions, deep liquidity, and spreads from 0.0 pips (additional fees may apply). Open your FXOpen account now or learn more about trading forex with FXOpen.
This article represents the opinion of the Companies operating under the FXOpen brand only. It is not to be construed as an offer, solicitation, or recommendation with respect to products and services provided by the Companies operating under the FXOpen brand, nor is it to be considered financial advice.
Stay ahead of the market!
Subscribe now to our mailing list and receive the latest market news and insights delivered directly to your inbox.


Latest articles

Weekly Market Insights with Gary Thomson: The Week of Central Banks and Earnings
In this video, we’ll explore the key economic events and market trends, shaping the financial landscape. Get ready for insights into financial markets to help you navigate the week ahead. Let’s dive in!
In this episode of Market

Intel at a Crossroads: Earnings Beat Meets Technical Resistance
Intel has just delivered its strongest quarter in over fifteen years, and the market reaction says it all. Q2 2026 revenue surged 25% year-over-year to $16.1 billion, crushing the consensus estimate of $14.42 billion, while adjusted EPS of

Tesla: Complex Range Structure Breaks Down Following Quarterly Earnings
Tesla released its Q2 2026 results after the market closed on 22 July. Revenue increased 26% year-on-year to $28.24 billion, while vehicle deliveries reached a record 480,126 units. However, operating margin fell sharply to 1.4%, down from