


Market Analysis: USD/JPY Updates the High of the Year
FXOpen

As the USD/JPY chart shows, the Japanese currency exchange rate exceeded 138.8 yen per dollar this morning – the last time such a yen rate against the US dollar was fixed was in November 2022.
The USD/JPY peak was helped by statements from the Fed on Monday, signaling that monetary policy could remain tight for a long time to bring inflation back to the 2% target.
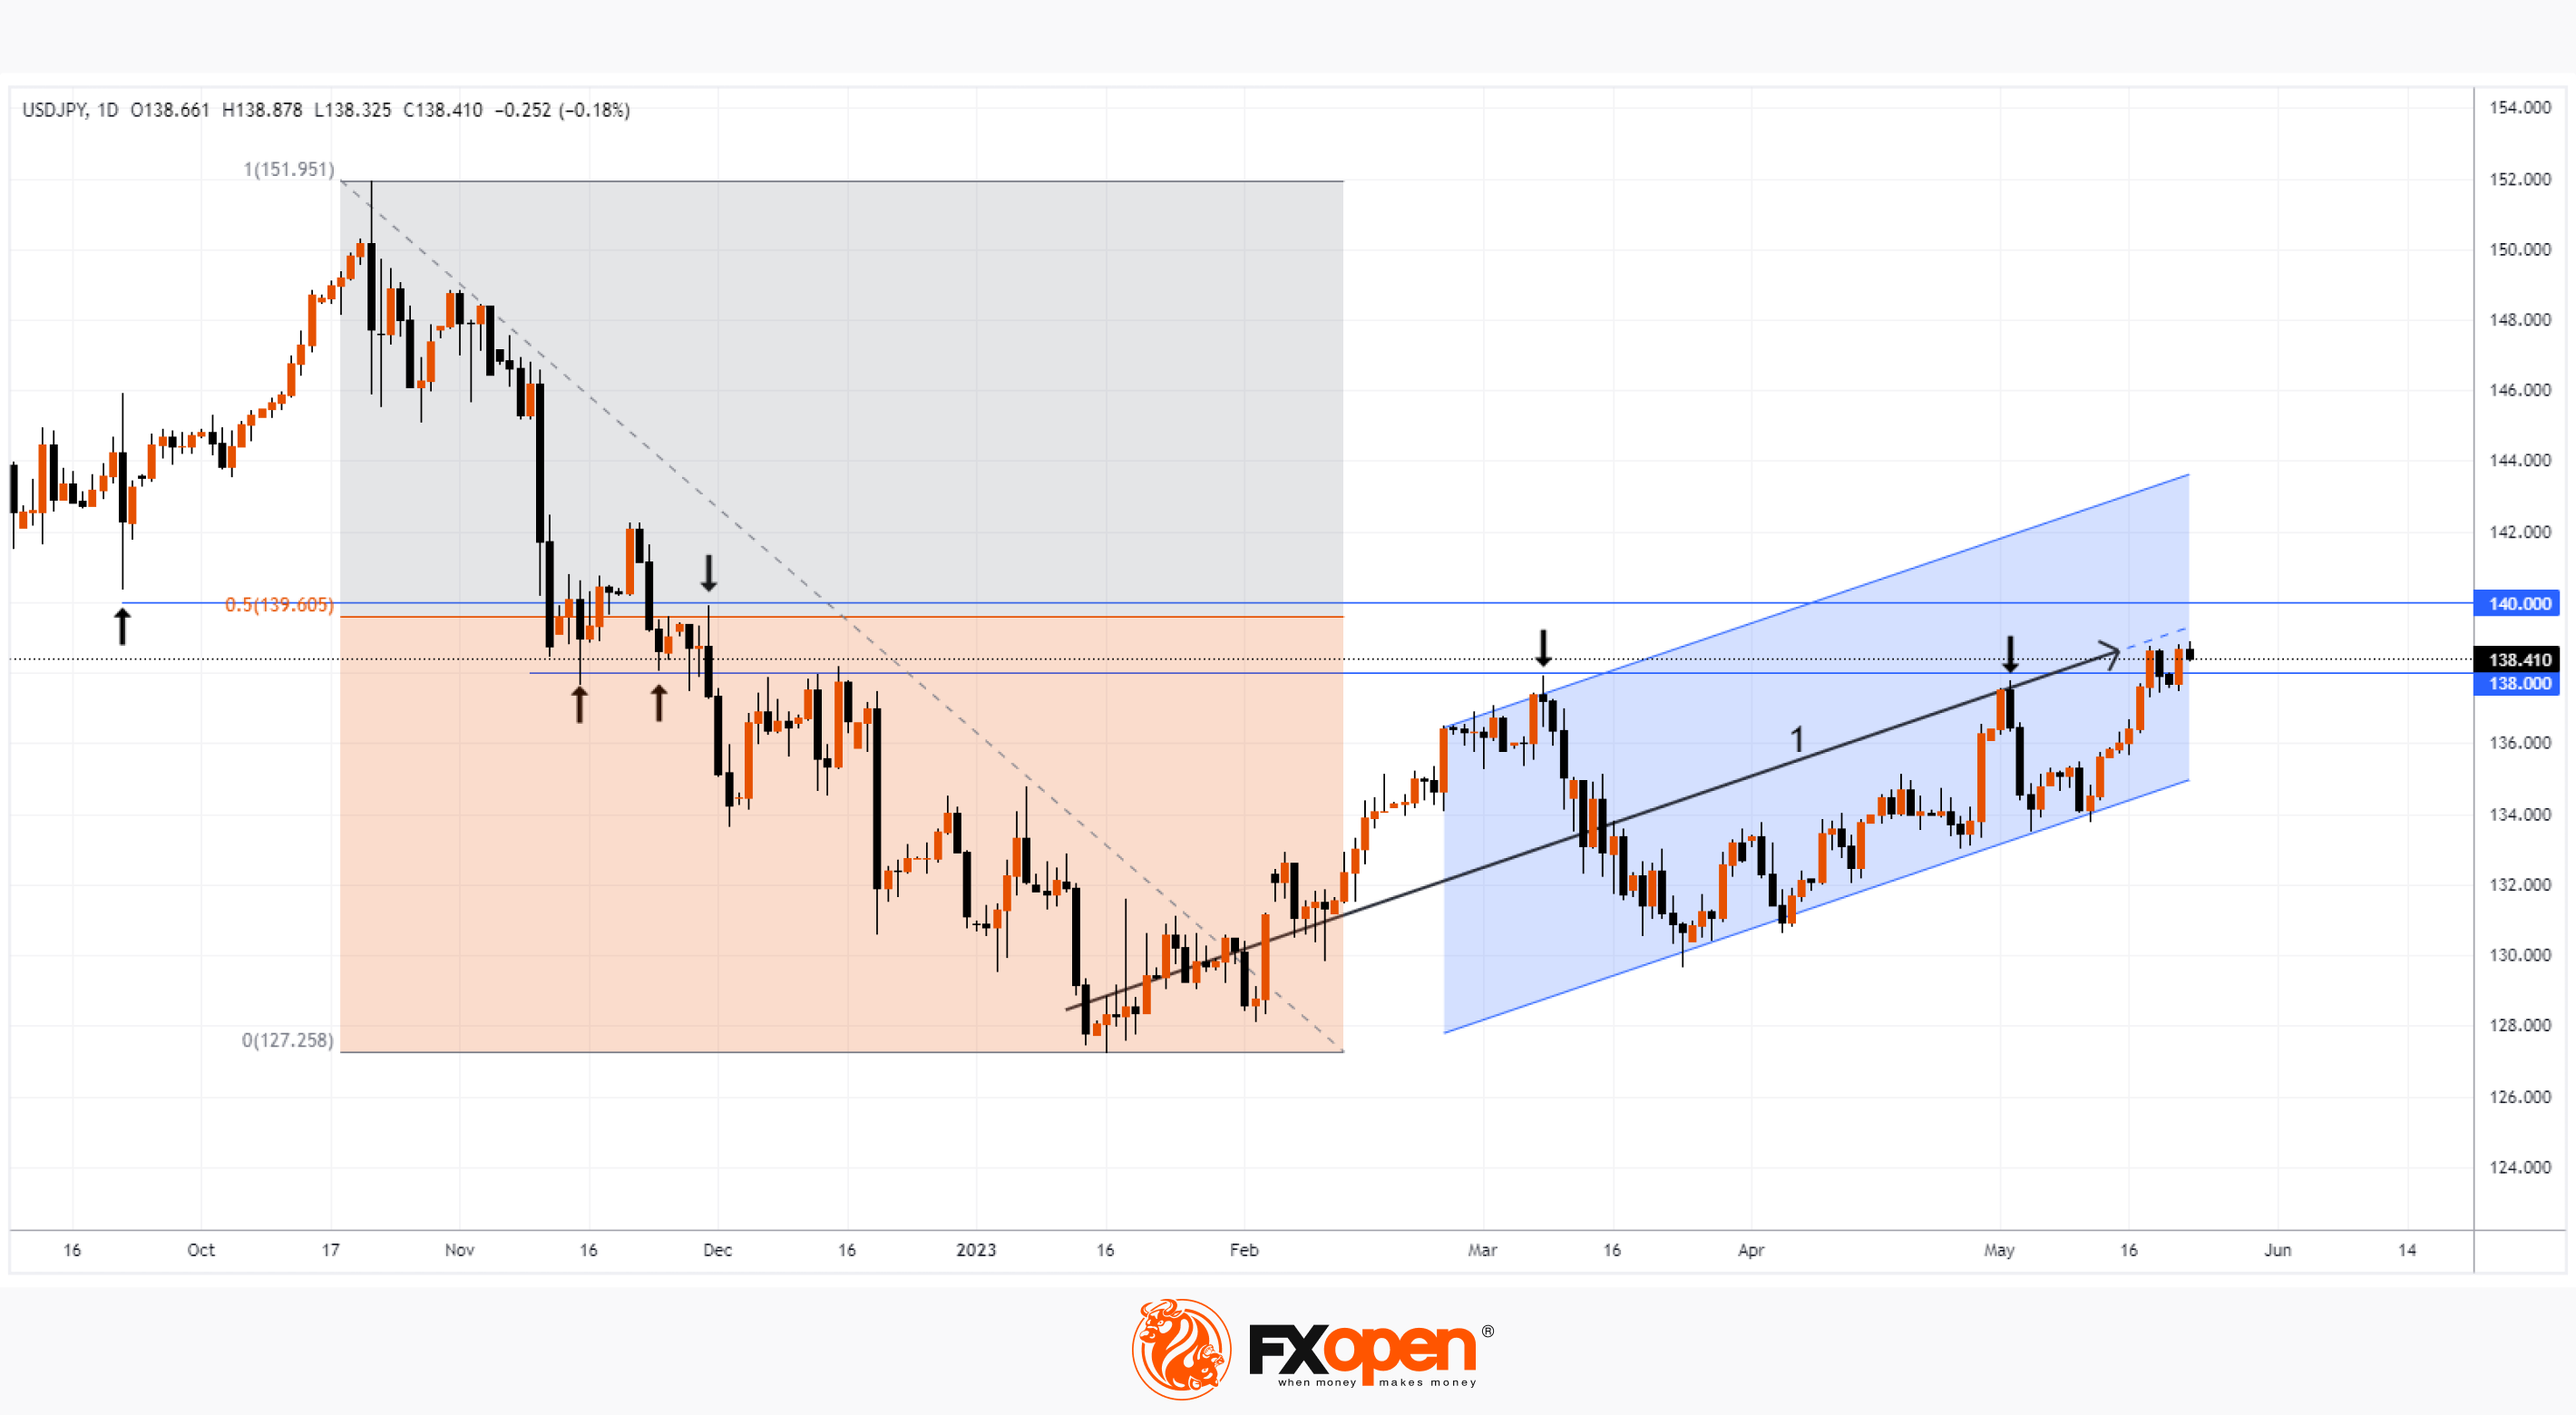
Based on the technical analysis of the USD/JPY pair, it is acceptable to assume that the rate may roll back, as the bulls are hindered by:
→ the presence of offers above the level of 138.0 is noticeable by the bearish candle on Friday;
→ approaching the psychological level of 140 yen per US dollar;
→ 50% level of decline from October 2022 peaks to January 2023 lows;
→ median line of the ascending channel (1).
Trade over 50 forex markets 24 hours a day with FXOpen. Take advantage of low commissions, deep liquidity, and spreads from 0.0 pips (additional fees may apply). Open your FXOpen account now or learn more about trading forex with FXOpen.
This article represents the opinion of the Companies operating under the FXOpen brand only. It is not to be construed as an offer, solicitation, or recommendation with respect to products and services provided by the Companies operating under the FXOpen brand, nor is it to be considered financial advice.
Stay ahead of the market!
Subscribe now to our mailing list and receive the latest market news and insights delivered directly to your inbox.


Latest articles

EUR/USD Eyes Gains As USD/CHF Weakness Deepens Again
EUR/USD started a fresh increase above 1.1700 and 1.1720. USD/CHF declined further and is now struggling below 0.7835.
Important Takeaways for EUR/USD and USD/CHF Analysis Today
· The Euro started a decent increase from

Apple: Earnings Day Above the Activity Zone
On 30 April, after the market close, Apple Inc. will release its financial results for the second quarter of fiscal 2026. The consensus forecast, based on estimates from 31 analysts, points to revenue of around $109.7 billion, with expected

USD/JPY and USD/CHF Near Key Levels: The Dollar Supported by the Fed
The US dollar continues to trend upwards following the Federal Reserve meeting, drawing support from the regulator’s moderately hawkish stance and comments by Jerome Powell. Markets interpret the Fed’s rhetoric as a signal that restrictive policy is likely