


FXOpen

The US dollar index hit its highest level since early March this week, but the yuan is one of the few currencies to rise against the USD over the period.
This was facilitated, among other things, by strong economic data published today:
→ Industrial production growth in August amounted to +4.5% in annual terms (expected +3.9). This is the strongest progress in 1 month since autumn 2022.
→ Retail sales in August increased by 4.6% year on year (expected +3.0%).
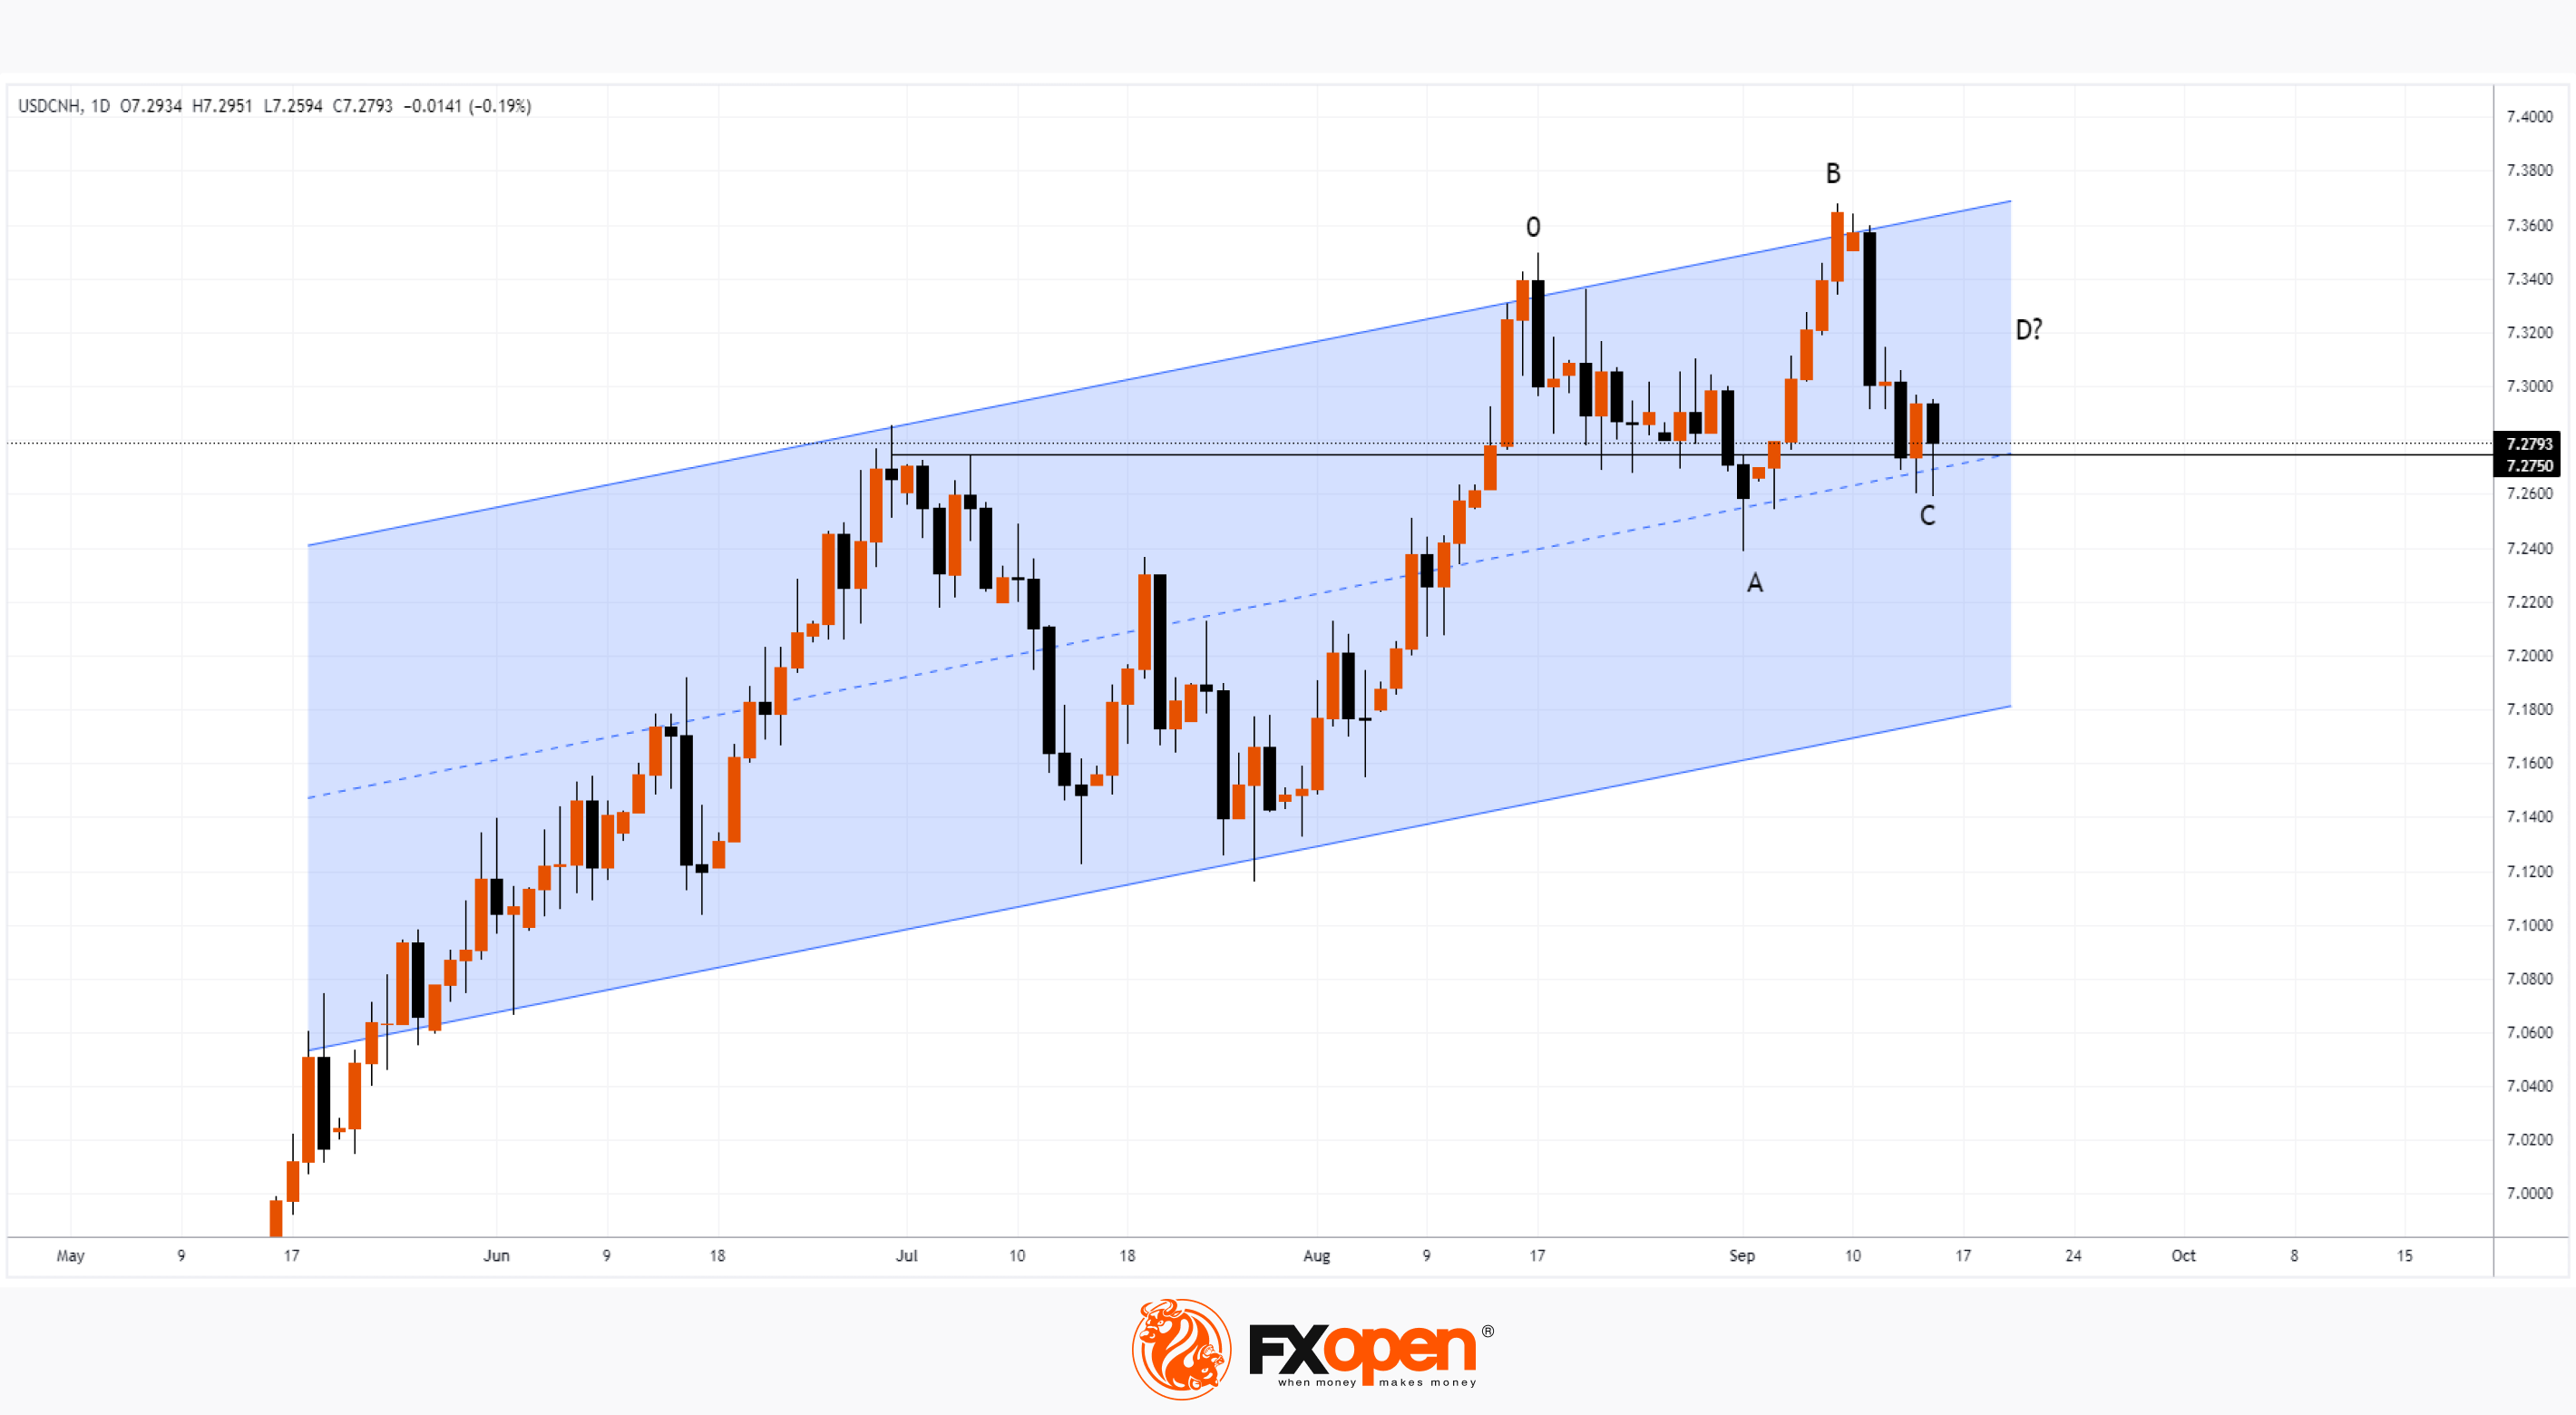
The chart shows that after a multi-year high (B) of about USD 7.36 per yuan set on September 8, the rate has retreated sharply. That is, sales of dollars (B→C) for yuan increased. And the sharp increase in A→B is completely leveled out. This is a bearish sign, indicating that the bulls have completely retreated.
Now the price is near the median line of the channel. Here one can expect support, which is also strengthened by the level of 7.275, which previously served as resistance.
Let’s say that if a rebound C→D occurs (its probability is indicated by the long lower shadows on the candles on September 14-15), then by its dynamics it will be possible to judge the sustainability of the initiative that the bears have taken. If the rebound is 50% of the momentum (B→C), this will confirm the change in sentiment to bearish, and then we can expect that sellers will be able to put pressure on the rate so that it will decline to the lower border of the channel.
And then the picture will be even more bearish, because a head-and-shoulders pattern will form on the chart along the 0-B-D vertices. Provided the positive news background regarding the Chinese economy continues, we will be able to witness the formation of a stable bearish trend in favor of the yuan.
Trade over 50 forex markets 24 hours a day with FXOpen. Take advantage of low commissions, deep liquidity, and spreads from 0.0 pips (additional fees may apply). Open your FXOpen account now or learn more about trading forex with FXOpen.
This article represents the opinion of the Companies operating under the FXOpen brand only. It is not to be construed as an offer, solicitation, or recommendation with respect to products and services provided by the Companies operating under the FXOpen brand, nor is it to be considered financial advice.
Stay ahead of the market!
Subscribe now to our mailing list and receive the latest market news and insights delivered directly to your inbox.


Latest articles

Market Analysis: EUR/USD Reclaims Ground While USD/JPY Momentum Fades
EUR/USD is recovering losses from 1.1500. USD/JPY is correcting gains from 159.00 and might decline further if it stays below 158.30.
Important Takeaways for EUR/USD and USD/JPY Analysis Today
· The Euro struggled to

Market Insights with Gary Thomson: Where Are Oil, Gas & Global Indices Heading?
In this video, we’ll explore the key economic events and market trends, shaping the financial landscape. Get ready for insights into financial markets to help you navigate the week ahead. Let’s dive in!
In this episode of Market

Netflix (NFLX) Shares Pull Back After a 30% Surge
On 21 January, while analysing the NFLX chart, we:
→ identified a descending channel and a resistance zone around the $100 level;
→ noted that Netflix shares were showing a sustained downtrend. Selling pressure had been triggered primarily by reports of a