


FXOpen

On 7 October, we analysed the Meta Platforms (META) price chart and highlighted:
→ The formation of a long-term upward channel (marked in blue).
→ The key drivers supporting bullish sentiment.
We also emphasised the psychological significance of the $600 level.
Since then, the price has approached this level four times, only to be met with resistance each time (indicated by red arrows).
Yesterday, for the first time since mid-September, META’s price fell below $550, suggesting that the stock underperformed the broader market during October and November.
What’s Next?
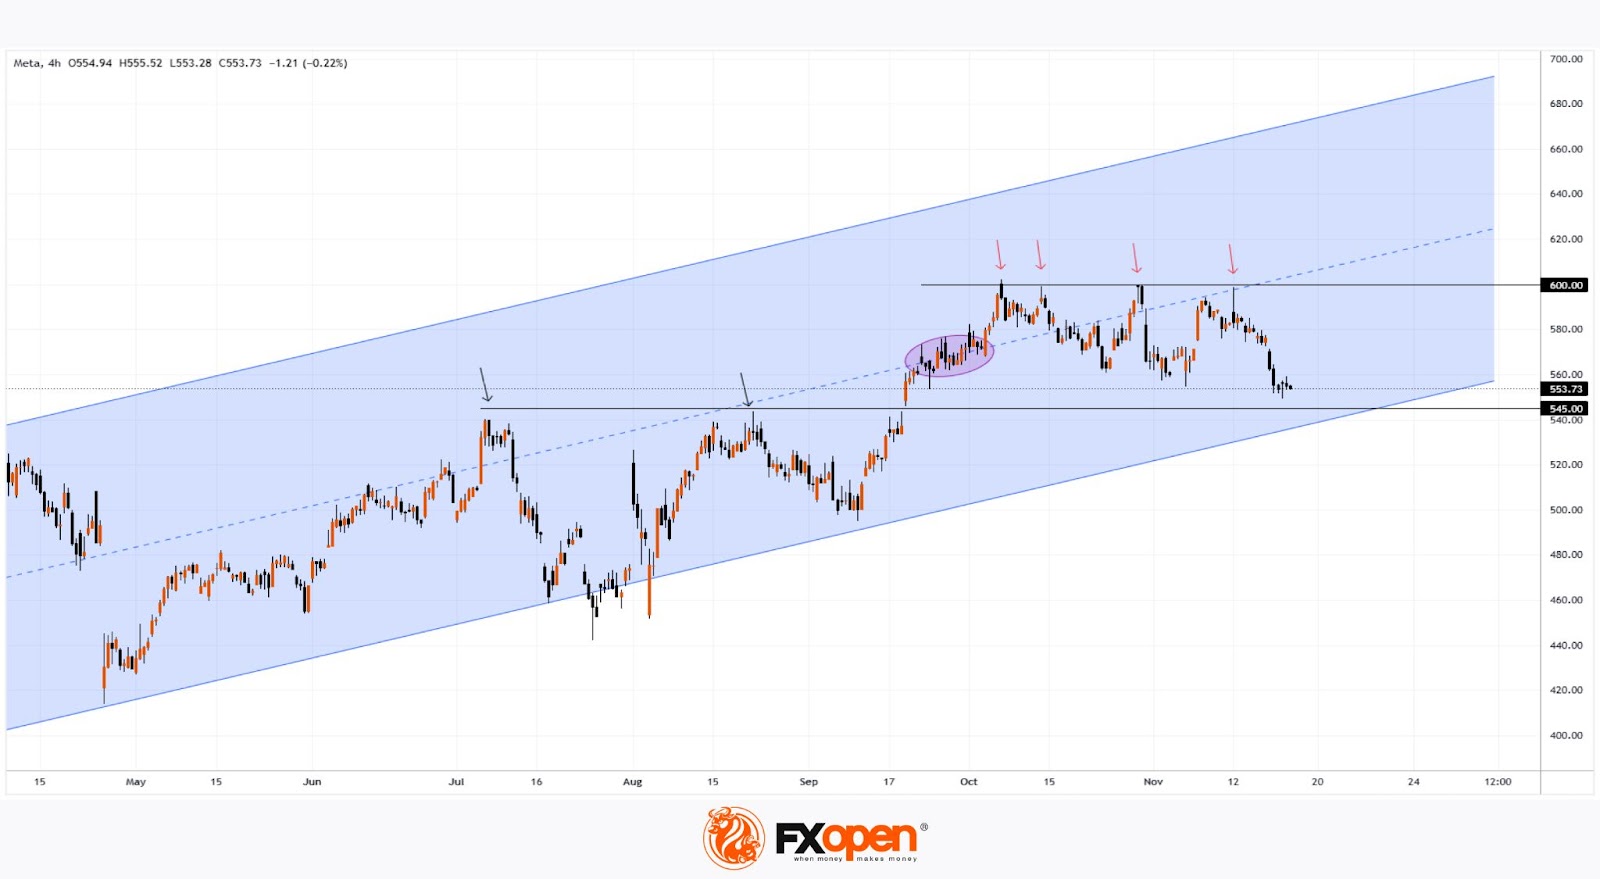
Technical analysis of the META price chart reveals that the stock is trading within a range defined by:
→ Resistance at $600, which has consistently proven robust.
→ Support at $545, a level that previously acted as resistance (marked by arrows).
While the channel median initially acted as a “magnet” for the price (highlighted with an oval), November patterns suggest the median now "repels" the price downward, a bearish indicator.
Bullish momentum might regain strength if the price approaches the lower boundary of the blue channel. However, the sustainability of demand at these levels and whether it can drive a successful breakout above $600 remains uncertain.
Analysts remain optimistic. According to a TipRanks survey:
→ 40 out of 44 analysts recommend buying META shares.
→ The average 12-month price target for META is $662.
Buy and sell stocks of the world's biggest publicly-listed companies with CFDs on FXOpen’s trading platform. Open your FXOpen account now or learn more about trading share CFDs with FXOpen.
This article represents the opinion of the Companies operating under the FXOpen brand only. It is not to be construed as an offer, solicitation, or recommendation with respect to products and services provided by the Companies operating under the FXOpen brand, nor is it to be considered financial advice.
Stay ahead of the market!
Subscribe now to our mailing list and receive the latest market news and insights delivered directly to your inbox.


Latest articles

Market Analysis: GBP/USD Dips Further As EUR/GBP Regains Traction
GBP/USD failed to climb above 1.3500 and corrected some gains. EUR/GBP started a decent increase and might aim for more gains above 0.8700.
Important Takeaways for GBP/USD and EUR/GBP Analysis Today
· The British Pound


Market Insights with Gary Thomson: Oil, US Retail Sales & NFP in Focus
In this video, we’ll explore the key economic events and market trends, shaping the financial landscape. Get ready for insights into financial markets to help you navigate the week ahead. Let’s dive in!
In this episode of Market