


FXOpen

On Wednesday, Meta Platforms (META) released its quarterly report, which included several positive highlights:
→ revenue rose to $51.2 billion (forecast: $49.5 billion);
→ the size of the daily active audience increased to 3.54 billion people.
However, META’s share price fell below the psychological threshold of $700, hitting its lowest level in almost five months. This drop was triggered by two unpleasant surprises revealed in the report.
Tax write-offs
According to media reports, due to new US tax legislation (referred to as the “One Big Beautiful Bill Act”), the company recorded a one-off income tax expense of $15.93 billion.
Because of this write-off, earnings per share (EPS) came in at $1.05 (analysts had expected $6.72). However, the company clarified that excluding this one-off item, EPS would have been $7.25, which would have been a very strong result.
AI-related expenses
Another factor that may have alarmed shareholders is that Mark Zuckerberg’s company raised its capital expenditure forecast for 2025 to $70–72 billion. These funds will go towards building data centres and purchasing AI chips.
In essence, Meta Platforms is striving to take a leading position in the AI space and is prepared to spend tens of billions to achieve that goal. For shareholders, this means that even as revenue grows, net profit is being eroded by massive spending—and it remains unclear when these costs will pay off.
Technical analysis of META’s chart
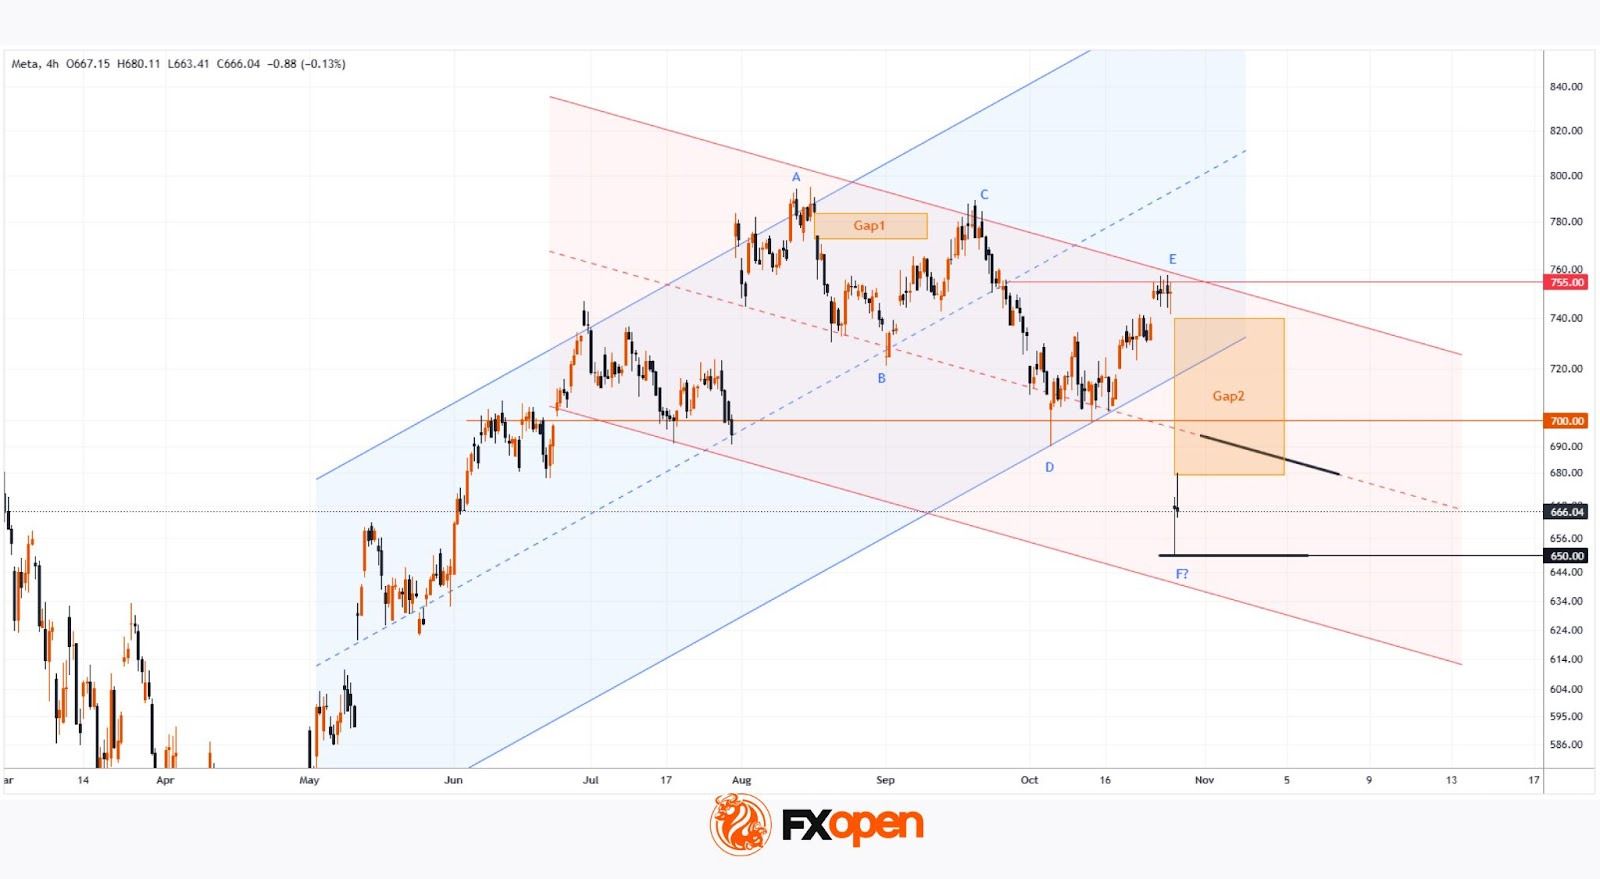
When analysing META’s chart in mid-August, we:
→ drew an ascending channel (shown in blue);
→ pointed out signs of weakness (including a bearish gap¹, shown in orange);
→ suggested that the balance could shift in favour of the bears, which might trigger a noticeable correction in META’s share price.
This scenario played out as a decline from A → B. After rebounding from the key line of the blue channel, the price rose towards the bearish gap¹, forming a lower high C. The downward movement then continued, and the channel was extended with a lower low D.
The large bearish gap² that formed this week could also act as resistance (as in the previous case), and this effect is likely to be more pronounced near the $700 psychological level.
Overall, the picture looks extremely negative:
→ the sequence of lower highs and lows A → D is likely to continue with a new lower low F;
→ the price remains in the lower half of the red channel, drawn along this sequence.
From a bullish perspective:
→ $650 serves as a psychological support level;
→ if the rise from the April low to peak A is viewed as an impulse, then the decline A → F is approaching $640, corresponding to the 50% Fibonacci retracement level.
Given the above, it is reasonable to assume that the market will now reassess the new factors revealed in the report. From a charting standpoint, this could mean a period of consolidation, with META’s share price fluctuating between the red median line and the current support level of $650.
Buy and sell stocks of the world's biggest publicly-listed companies with CFDs on FXOpen’s trading platform. Open your FXOpen account now or learn more about trading share CFDs with FXOpen.
This article represents the opinion of the Companies operating under the FXOpen brand only. It is not to be construed as an offer, solicitation, or recommendation with respect to products and services provided by the Companies operating under the FXOpen brand, nor is it to be considered financial advice.
Stay ahead of the market!
Subscribe now to our mailing list and receive the latest market news and insights delivered directly to your inbox.


Latest articles

Tesla (TSLA) Shares Surge Following Musk’s Announcements
According to the chart, Tesla (TSLA) shares had been under significant pressure since the start of 2026: from their December high, they had lost around 25% of their value. The main bearish drivers included:
→ Intense competition from Chinese automakers, particularly

XTI/USD Analysis: WTI Oil Prices Under Pressure from Trump’s Statements
Yesterday, following a false bullish breakout above the psychological $100 level, WTI crude prices fell sharply towards the $85 area. The primary driver of this rapid decline was comments made by the US President.
According to Donald Trump:
→ the United
