


FXOpen

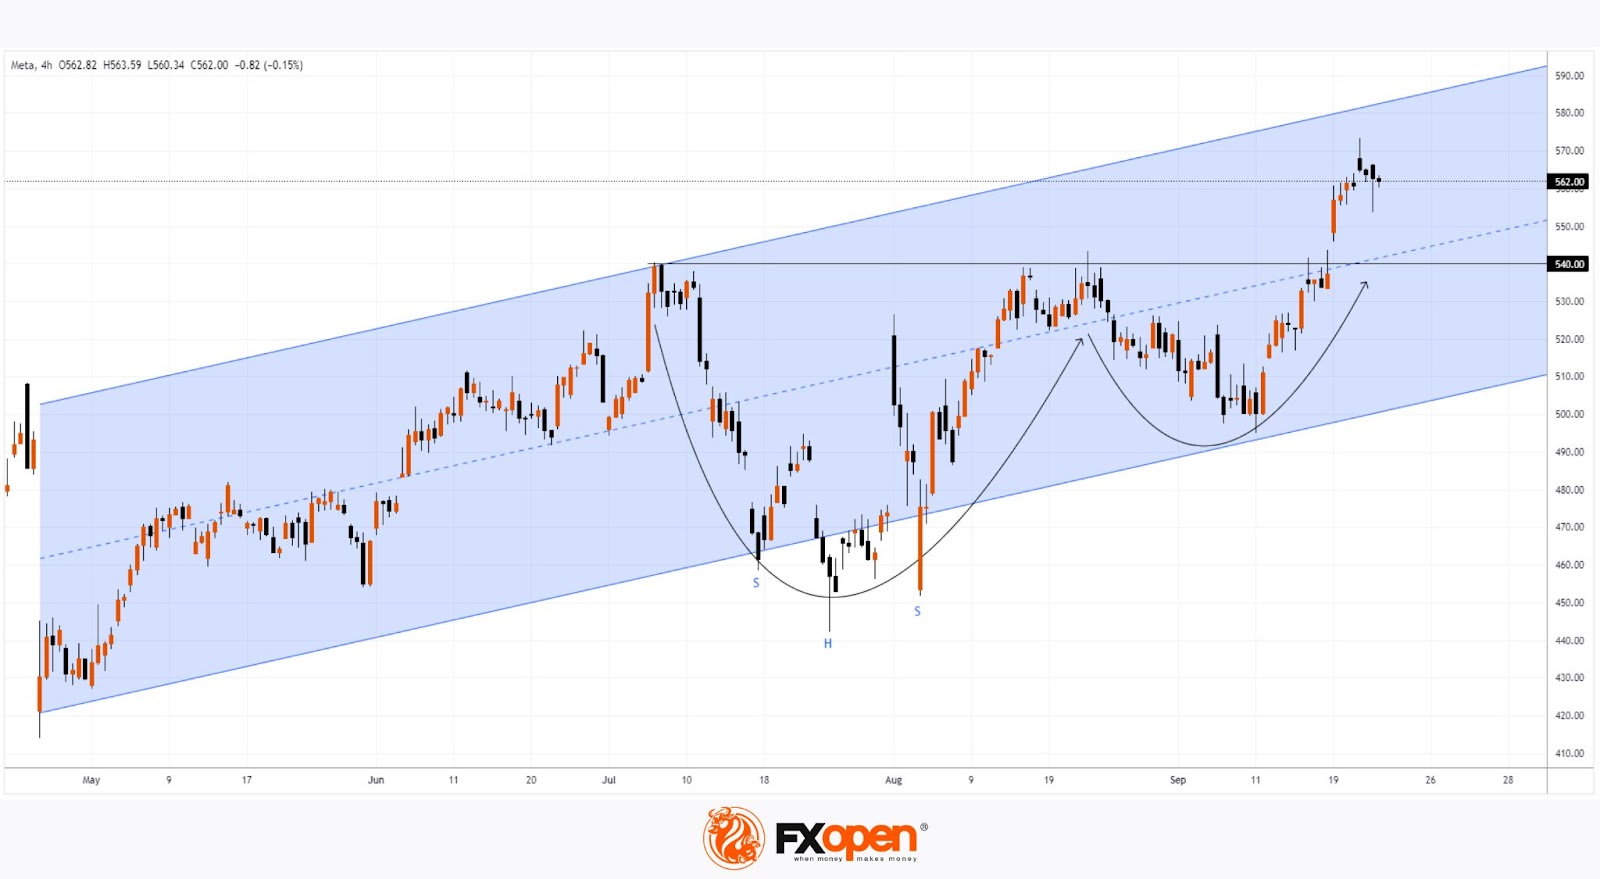
As shown on the Meta Platforms (META) stock chart, the price remains around the $560 level, less than 2% away from the all-time high of over $570, reached on 23 September.
A significant gain of approximately 3.80% in one day was achieved on 19 September, driven by increased demand for shares following the Federal Reserve’s decision to ease monetary policy.
Technical analysis of the META stock chart indicates that:
→ The price is forming an upward channel (constructed using the linear regression method, marked in blue), currently sitting in the upper half of this channel.
→ Prior to breaking through key resistance at $540, the price trajectory formed a bullish "inverse cup with handle" pattern, which aligns with another bullish pattern – an "inverse head and shoulders."
→ The bullish gap that appeared on 19 September could act as a key support zone, helping the price stay above the former resistance at $540.
Will the bullish trend in Meta Platforms (META) stock continue? Much will depend on the Meta Connect conference taking place today.
As Barron’s reports:
→ CEO Mark Zuckerberg will deliver the keynote address, where he is expected to outline the company’s vision for artificial intelligence and announce Meta’s latest product developments.
→ The Verge predicts that Meta may unveil new versions of the Quest 3 virtual reality headset and Ray-Ban Meta smart glasses.
If the announcements prove groundbreaking, it’s possible the META stock price could reach the upper boundary of the blue channel. On the other hand, investor disappointment could put pressure on the key $540 level.
Buy and sell stocks of the world's biggest publicly-listed companies with CFDs on FXOpen’s trading platform. Open your FXOpen account now or learn more about trading share CFDs with FXOpen.
This article represents the opinion of the Companies operating under the FXOpen brand only. It is not to be construed as an offer, solicitation, or recommendation with respect to products and services provided by the Companies operating under the FXOpen brand, nor is it to be considered financial advice.
Stay ahead of the market!
Subscribe now to our mailing list and receive the latest market news and insights delivered directly to your inbox.


Latest articles

Consolidation Ahead of NFP: Commodity Currencies Search for Direction
Commodity-linked currencies have entered a consolidation phase following recent directional moves, as market participants adopt a wait-and-see approach ahead of key US labour market data. Current price action reflects a balance between ongoing demand for the US dollar and attempts

The Real Driver Behind the Dollar Rally: Market Insights with Gary Thomson
The US dollar has been firm, but the drivers behind the move may be more complex than they first appear.
While geopolitical tension and shifts in risk sentiment play a role, current price behaviour seems increasingly influenced by inflation expectations

EUR/USD and USD/CHF Pull Back: Market Reacts to Fundamentals
European currencies have shown a recovery in recent trading sessions after their recent decline, displaying early signs of a reversal. The US dollar is weakening amid expectations surrounding upcoming US macroeconomic data, while market participants are reassessing their short-term positions