


What Is an Inverse Head and Shoulders Pattern in Trading?
FXOpen
It's known that traders, even with little experience, use the head and shoulders pattern. However, it has an inverted version. The inverse head and shoulders is one of the most common patterns experienced traders use in their journeys in the trading world. In this FXOpen article, we will tell you how to spot the inverse head and shoulders pattern and build your own strategies with this formation.
What Is an Inverse Head and Shoulders Pattern?
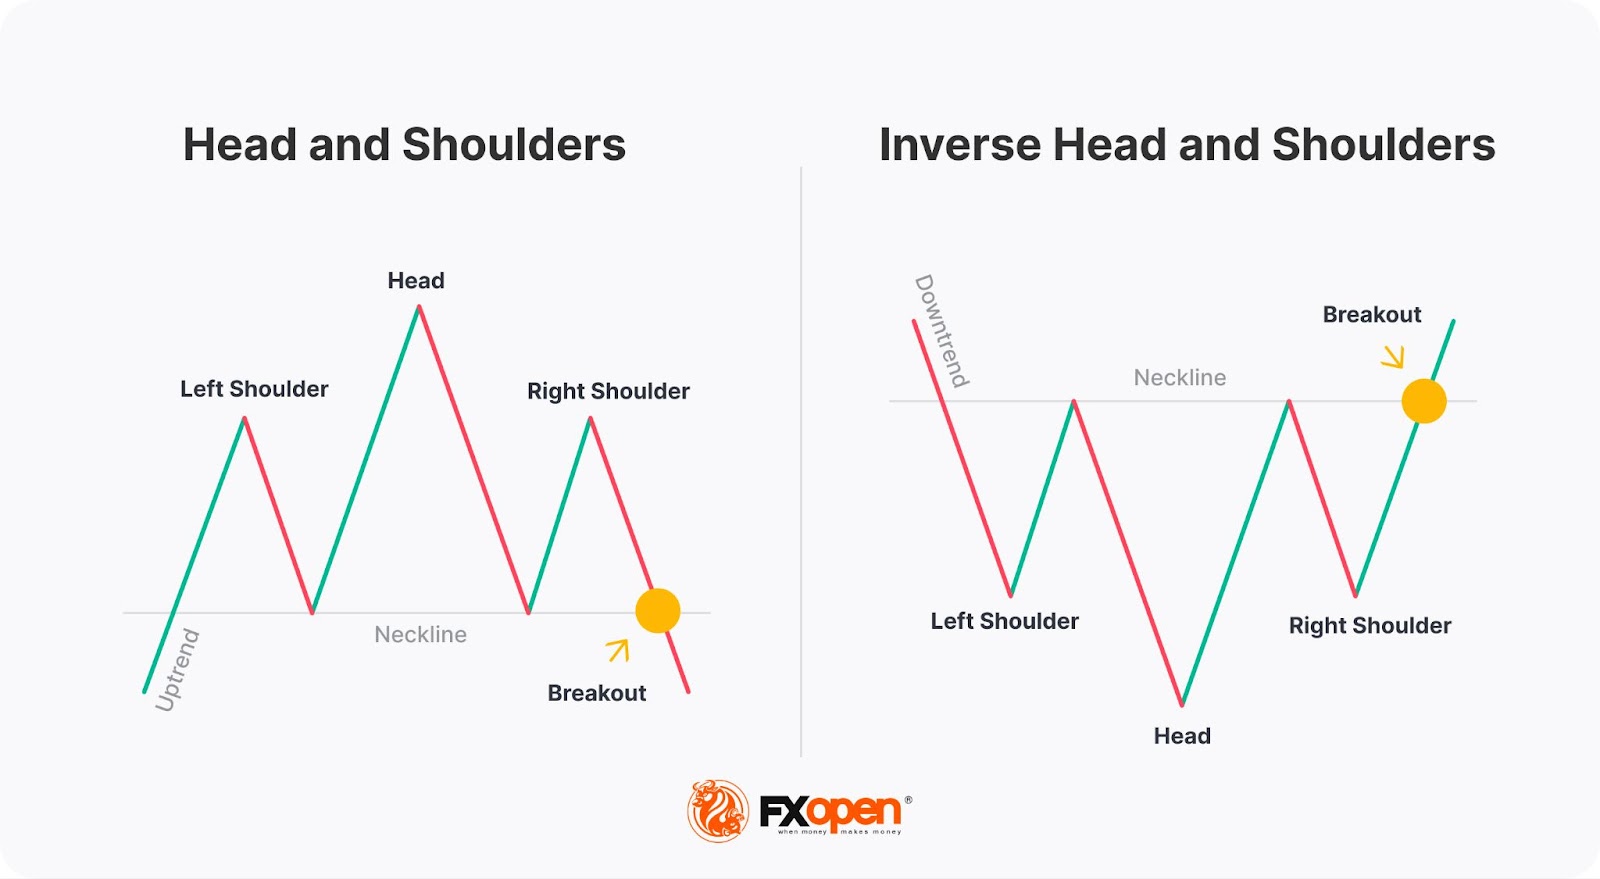
An inverse head and shoulders pattern, sometimes known as an inverted head and shoulders pattern, is a chart formation that appears at the end of a downtrend. Is the inverse head and shoulders bullish or bearish? It’s a bullish setup that demonstrates a potential reversal from a downtrend to an uptrend.
It consists of three parts: a low (left shoulder), a lower low (head), and a higher low (right shoulder), forming at the end of a downtrend. Traders identify the inverse head and shoulders trading pattern by finding a downtrend that shows signs of weakening, and then looking for these three components.
The pattern is confirmed when the price breaks above the resistance level, known as the neckline, formed by connecting the peaks between the shoulders and the head. This breakout suggests that bulls are gaining control, signalling a potential upward price movement. This pattern is versatile, appearing on various timeframes and asset classes, making it useful for forex, stock, cryptocurrency* and other markets. However, traders can only spot the inverse head and shoulders pattern in a downtrend, not an uptrend.
The opposite of this pattern is the head and shoulders formation, which provides bearish signals.
The Psychology Behind the Inverse Head and Shoulders Chart Pattern
The pattern reveals the psychological transition where bears lose momentum, and bulls prepare to drive prices upward. Initially, sellers dominate, driving prices to new lows (head). However, buying interest begins to emerge. The subsequent higher low (second shoulder) indicates waning selling pressure and increasing buyer confidence. This shift culminates in a breakout above the neckline, signalling a reversal.
How Can You Spot the Inverted Head and Shoulders Pattern?
To identify this formation on the chart, you need to find a downtrend, which is close to a reversal. To determine whether the trend is becoming weaker, you can use trend strength indicators like ADX. Another sign of a weakening trend is its length. You can identify the average length of a trend on a timeframe you trade and compare it to the one you plan to trade in.
Once you find a weakening trend, you can draw the inverse head and shoulders formation.
The price should rebound from a low to form a left shoulder (1). Next time, in the inverse head and shoulders pattern, selling volumes should increase, so the price will break below the previous low and form another one (2). This will be a head. The price should rebound again. In the third attempt, bears will pull the price down but won’t be able to reach the previous low (3), and the price will rebound almost at the same level as the left shoulder. This will be the right shoulder. After it has formed, bulls are likely to push the price above the resistance level. The resistance level, in turn, is drawn through the peaks between the head and shoulders (4).
The construction is simple – you need to find two troughs at almost the same level with a lower one in between at the end of a downtrend.
The Inverse Head and Shoulders: Trading Rules
There are some common inverse head and shoulders pattern rules that you can use; however, you can still develop your own trading strategy and try other entry and exit points.
The rules slightly differ for aggressive (risky) and conservative approaches. You can open an FXOpen account to test both.
Conservative Approach
Entry. In a conservative approach, traders usually open a buy position only after at least a few candlesticks close above the neckline. This can potentially limit the risks of a false breakout*. Another option is to use a buy limit order at or slightly below the neckline. It’s very often that the price rebounds to the neckline after a breakout. By placing a buy limit order, traders can potentially reduce the slippage. However, the price may continue to rise without a retracement to the neckline, so a trader will miss a trade.
*A false breakout occurs when bulls don’t have enough strength to push the price further up.
Stop loss. A stop-loss order is placed below the neckline. However, it’s not easy to identify its size. If the level is too close to the resistance point, the trade can be closed early due to a short-term price pullback. If the level is far from the neckline, there is a risk of increased losses in case of a losing trade.
Therefore, traders usually use a risk/reward ratio of 1:2 or 1:3, depending on the market conditions and the trading approach.
Take profit. An inverse head and shoulders target usually equals the distance between the head and the neckline. A trader can trail the profit target, considering the trend's strength and fundamental factors affecting the price direction.
Aggressive Approach
Entry. In an aggressive approach, traders prefer to enter the market when the price breaks above the neckline; usually, they place a buy stop order above that point. This approach allows traders to open a trade early in a new trend. However, it's risky because of the possibility of a fakeout and increased slippage.
Stop loss. For a failed inverse head and shoulders pattern, a stop-loss order is placed according to the same rule as in the conservative approach. However, traders usually consider narrower stop-loss areas because the risk is higher.
Take profit. A take-profit target will equal the distance between the head and the neckline.
The Inverse Head and Shoulders Pattern: Trading Example
Let’s consider how to trade the inverse head and shoulders in the forex market.
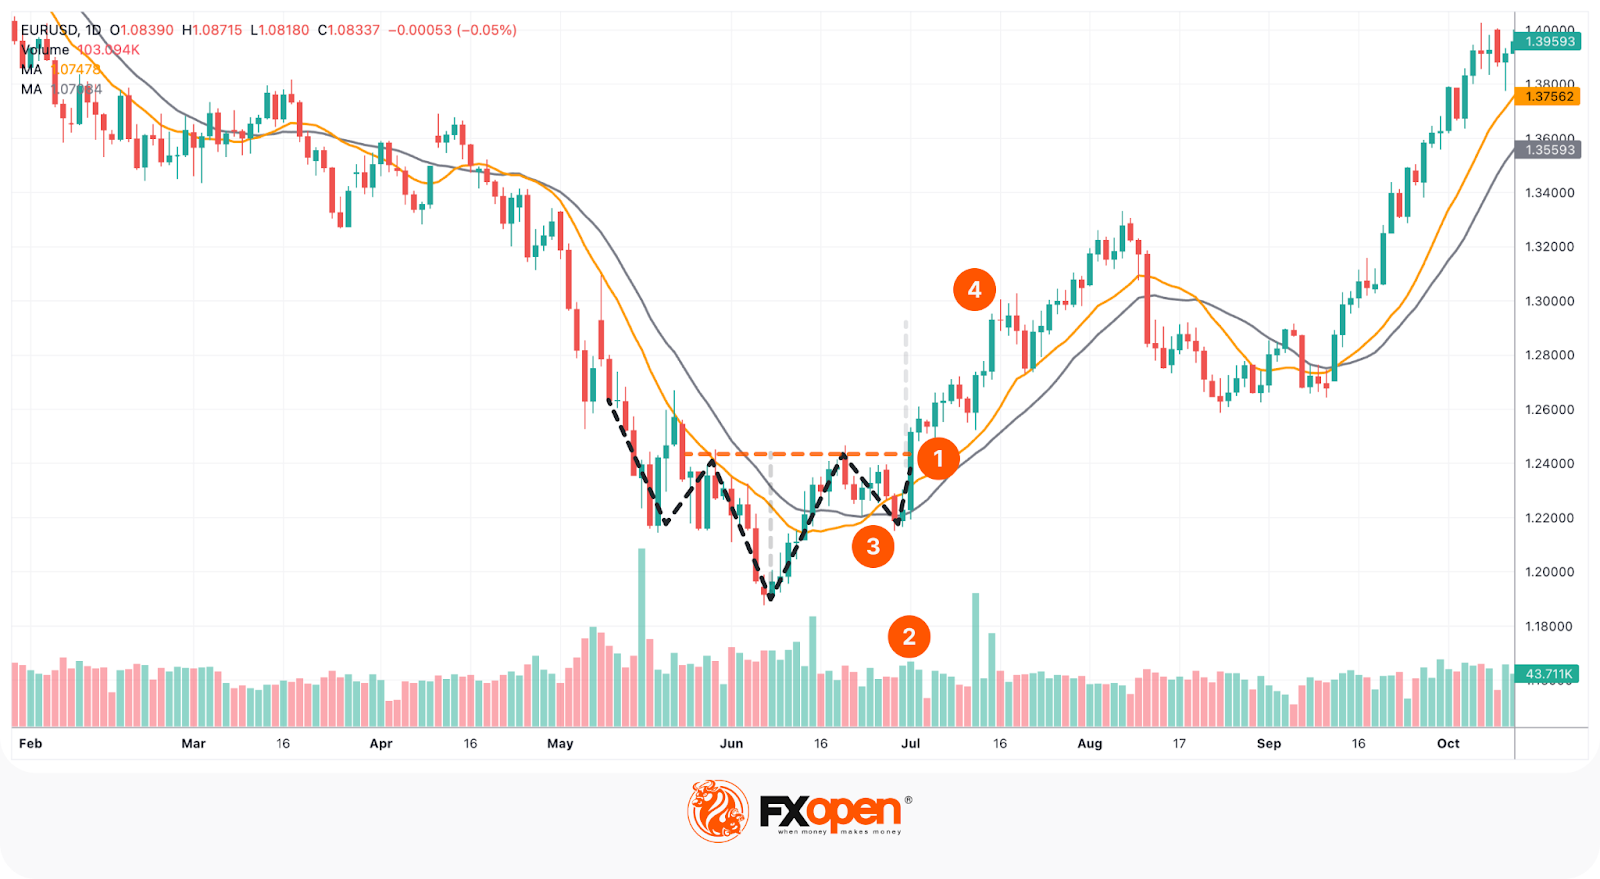
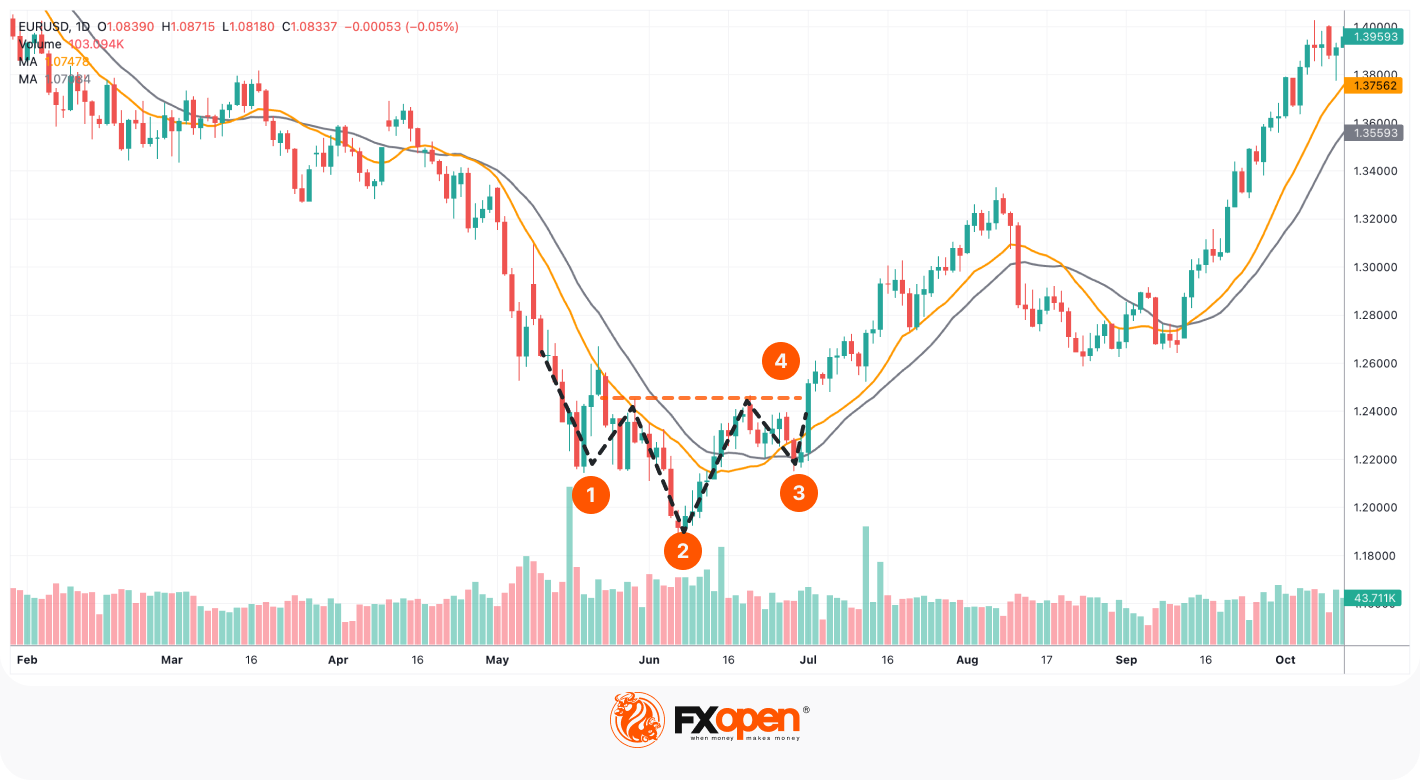
On the daily chart of the EUR/USD pair, the price formed an inverse H&S pattern. A breakout is always followed by an increase in trading volumes. To confirm the price breakout (1), a trader could have used a volume indicator. In the reverse head and shoulders chart above, the volumes rose when the price broke above the neckline (2). However, this wasn’t enough to confirm a trade. A trader could have used a moving average crossover. The 14-day moving average moved above the 21-day MA before the breakout (3). This was a signal of a trend reversal.
Note: Although traders usually use longer-term moving averages on a daily chart, they provide lagging signals and confirm a solid trend direction. Short-term MAs are more sensitive to price fluctuations, so they reflect even short-term movements within a strong trend.
The entry point would have depended on the trader’s approach. The take-profit target would have equaled the distance between the head and the neckline (4). As the trend was strong, the trader could have used a trailing take-profit order and lifted the target. The stop-loss level could have been placed according to the risk/reward ratio and changed accordingly if there had been a trailing take profit.
The Inverse Head and Shoulders Pattern: Limitations
The upside-down head and shoulders formation is an approach that can be used easily by traders with any level of experience. However, it has some limitations that should be considered before entering a live market.
- False breakout. As with other chart patterns whose signals are based on a breakout, you may face a false breakout. To limit the risks, traders commonly use stop-loss orders and confirm breakouts with other trading tools, including volume and trend indicators.
- False trend reversal. Sometimes, the price breaks above the resistance level and moves the distance predetermined by the common H&S rules but turns around. This may happen in a solid long-term trend when the market needs a break.
Inverse Head and Shoulders Reversal Pattern and Technical Indicators
As with many reversal chart patterns, combining the inverse head and shoulders pattern with technical indicators can potentially enhance the accuracy of signals. Here’s how different types of indicators can be used:
- Trend Indicators: These help confirm the reversal. Examples include Moving Averages (MA) and the Average Directional Index (ADX). When the price breaks above the neckline, an upward crossover of short-term and long-term MAs or a rising ADX supports the bullish reversal.
- Momentum Indicators: These gauge the speed of price movements. Relative Strength Index (RSI) and Moving Average Convergence Divergence (MACD) are commonly used. An RSI moving above 50 or a bullish MACD crossover can confirm the strength of the new uptrend.
- Volatility Indicators: These measure the price fluctuation rate. Bollinger Bands and the Average True Range (ATR) are popular choices. A contraction followed by an expansion in Bollinger Bands can indicate a breakout, while a rising ATR suggests increasing price movement, reinforcing the reversal signal.
- Volume Indicators: These assess the strength of price movements through trading volume. On-Balance Volume (OBV) and Chaikin Money Flow can be used. A volume spike or increasing OBV during the breakout above the neckline provides additional confirmation of a bullish trend.
Traders can find each of the indicators discussed here in FXOpen’s free TickTrader platform.
Takeaway
The inverse head and shoulders pattern is a powerful tool for identifying market reversals. Combining it with technical analysis indicators of different types, such as trend, momentum, volatility, and volume, can potentially enhance the accuracy of its signals.
This pattern is accessible for traders of all levels, making it a versatile addition to your trading strategy. Consider practising identifying and trading this pattern, then open an FXOpen account to implement your strategy in real market conditions.
FAQ
What Is an Inverse Head and Shoulders Pattern?
An inverse head and shoulders is a bullish chart pattern that signals a potential reversal from a downtrend to an uptrend. It features three parts: a low (left shoulder), a lower low (head), and a higher low (right shoulder).
How to Identify Inverse Head and Shoulders?
To identify an inverse head and shoulders pattern, look for a downtrend nearing its end. Spot three components: a low, followed by a lower low, and then a higher low. Confirm the pattern with a breakout above the neckline, which is formed by connecting the peaks between the shoulders.
What Happens After Head and Shoulders Pattern?
After a head and shoulders pattern, which is a bearish formation, a downtrend typically follows. This pattern indicates a reversal from an uptrend to a downtrend, signalling that sellers are gaining control and prices are likely to decrease. The opposite is true for an inverse head and shoulders bottom pattern; it demonstrates a reversal from a downtrend to an uptrend.
Is an Inverse Head and Shoulders Bullish?
Yes, an inverse head and shoulders pattern is bullish. It signals a reversal from a downtrend to an uptrend, indicating that buyers are gaining strength and prices are expected to rise.
*At FXOpen UK and FXOpen AU, Cryptocurrency CFDs are only available for trading by those clients categorised as Professional clients under FCA Rules and Professional clients under ASIC Rules, respectively. They are not available for trading by Retail clients.
This article represents the opinion of the Companies operating under the FXOpen brand only. It is not to be construed as an offer, solicitation, or recommendation with respect to products and services provided by the Companies operating under the FXOpen brand, nor is it to be considered financial advice.
Stay ahead of the market!
Subscribe now to our mailing list and receive the latest market news and insights delivered directly to your inbox.


Latest articles

Pound Weakens After Soft UK Inflation Data as Euro Awaits Fresh Market Signals
The pound remains under pressure following the release of weaker-than-expected UK inflation data. The slowdown in inflation has strengthened expectations that the Bank of England could adopt a more accommodative policy stance in the coming months, weighing on sterling. Meanwhile,

Alphabet: Record Profit as Markets Await Their Verdict
On 22 July, Alphabet reported its Q2 2026 results, with revenue rising 24% year-on-year to $119.8 billion. Google Cloud revenue surged 82% to $24.77 billion, comfortably exceeding analysts' expectations. Search advertising generated $63.3 billion in revenue (+17%

NZD/USD Analysis: A Tug-of-War at the Critical Level
The kiwi has strengthened meaningfully against most peers this month. However, against the US dollar specifically, NZD/USD remains well below its 2026 highs, trading in the mid-0.58 area versus January's peak near 0.6075.
New Zealand's Q2 inflation