


FXOpen

According to TipRanks, the average target price for META, as forecasted by Wall Street analysts, is $537.41 (a 12.94% increase from current levels) over the next 12 months. However, not all analysts remain positive.
Craig Johnson, Chief Market Technician at Piper Sandler, issued a warning about the future of the "Magnificent Seven" stocks, which include Microsoft (MSFT), Apple (AAPL), NVIDIA (NVDA), Meta Platforms (META), Tesla (TSLA), Amazon.com (AMZN), and Alphabet Inc. (GOOG and GOOGL).
"These charts are reversing, and they need further correction," he said on CNBC's Last Call programme.
Indeed, the market is sending alarming signals regarding the leaders. Yesterday, we wrote about the increasing signs of bearish aggression on Nvidia's stock chart; today, we'll assess the price action of Meta Platforms Inc.
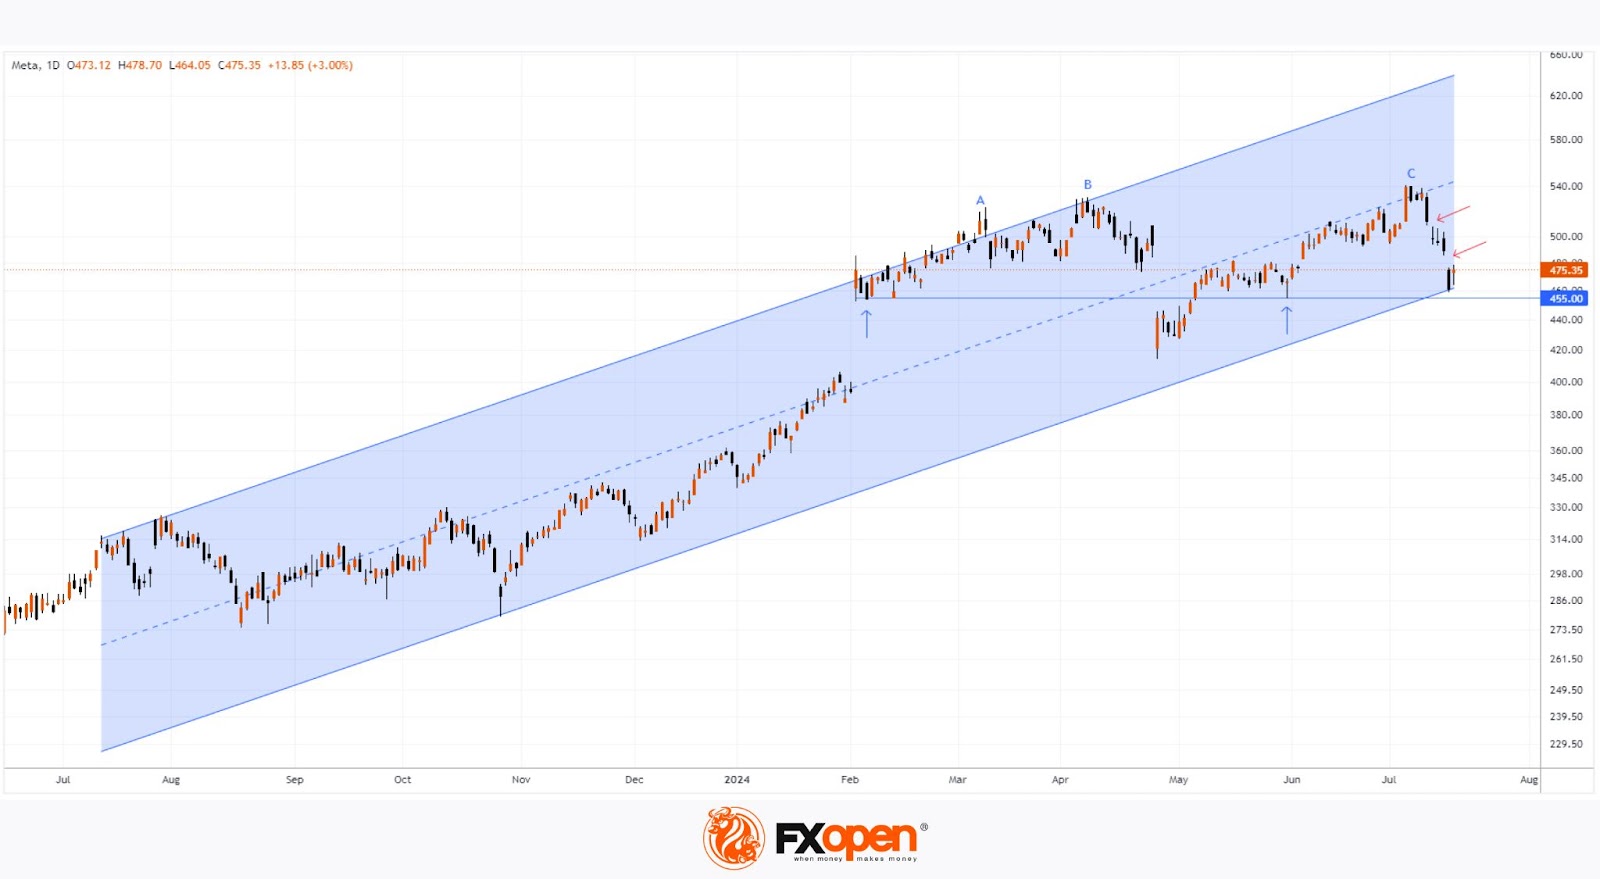
Technical analysis of META's daily chart shows that since the second half of last year, the price action is best described by an upward trend (indicated by the blue channel). However:
→ The price has fallen into the lower half of the channel, and the median shows signs of resistance (judging by the price action from 8-10 July).
→ The formation of peaks A-B-C indicates a worrying trend: the price is unable to consolidate at the achieved peaks. We see only a slight excess over the previous maximum – a sign of bullish uncertainty.
→ Meanwhile, the bears are aggressive. Look at the bearish gaps (shown with red arrows) in July.
How might the situation develop further?
Currently, the META stock price is holding around the lower boundary of the trend channel, which is reinforced by the $455 level that previously acted as support (shown with blue arrows). But, given the aggressive activity of the bears, it is reasonable to assume that the lower boundary is under significant pressure.
Buy and sell stocks of the world's biggest publicly-listed companies with CFDs on FXOpen’s trading platform. Open your FXOpen account now or learn more about trading share CFDs with FXOpen.
This article represents the opinion of the Companies operating under the FXOpen brand only. It is not to be construed as an offer, solicitation, or recommendation with respect to products and services provided by the Companies operating under the FXOpen brand, nor is it to be considered financial advice.
Stay ahead of the market!
Subscribe now to our mailing list and receive the latest market news and insights delivered directly to your inbox.


Latest articles

European Currencies Decline: Pound Hits New Lows, Euro Under Pressure
European currencies continue to weaken against the US dollar amid rising geopolitical tensions and increased demand for safe-haven and liquid assets. Market participants are reducing exposure to riskier instruments, putting pressure on both the euro and the pound. Additional support

Market Analysis: GBP/USD Dips Further As EUR/GBP Regains Traction
GBP/USD failed to climb above 1.3500 and corrected some gains. EUR/GBP started a decent increase and might aim for more gains above 0.8700.
Important Takeaways for GBP/USD and EUR/GBP Analysis Today
· The British Pound
