


Meta Share Price Soars to Record Thanks to First-ever Dividend
FXOpen

After the close of yesterday's trading session, the social media giant reported activity for the 4th quarter of 2023. The actual numbers exceeded expectations:
→ gross income: actual = USD 40.1 billion (expected = USD 39.1 billion);
→ earnings per share: actual = USD 5.3 (expected = USD 4.8).
Zuckerberg's company also announced a USD 50 billion share buyback and, most importantly, the decision to pay dividends for the first time!
As a result, META's share price soared approximately +15% to record highs. In the post-market, the META price exceeded USD 450 — this value may be a guideline for the opening of today's trading.
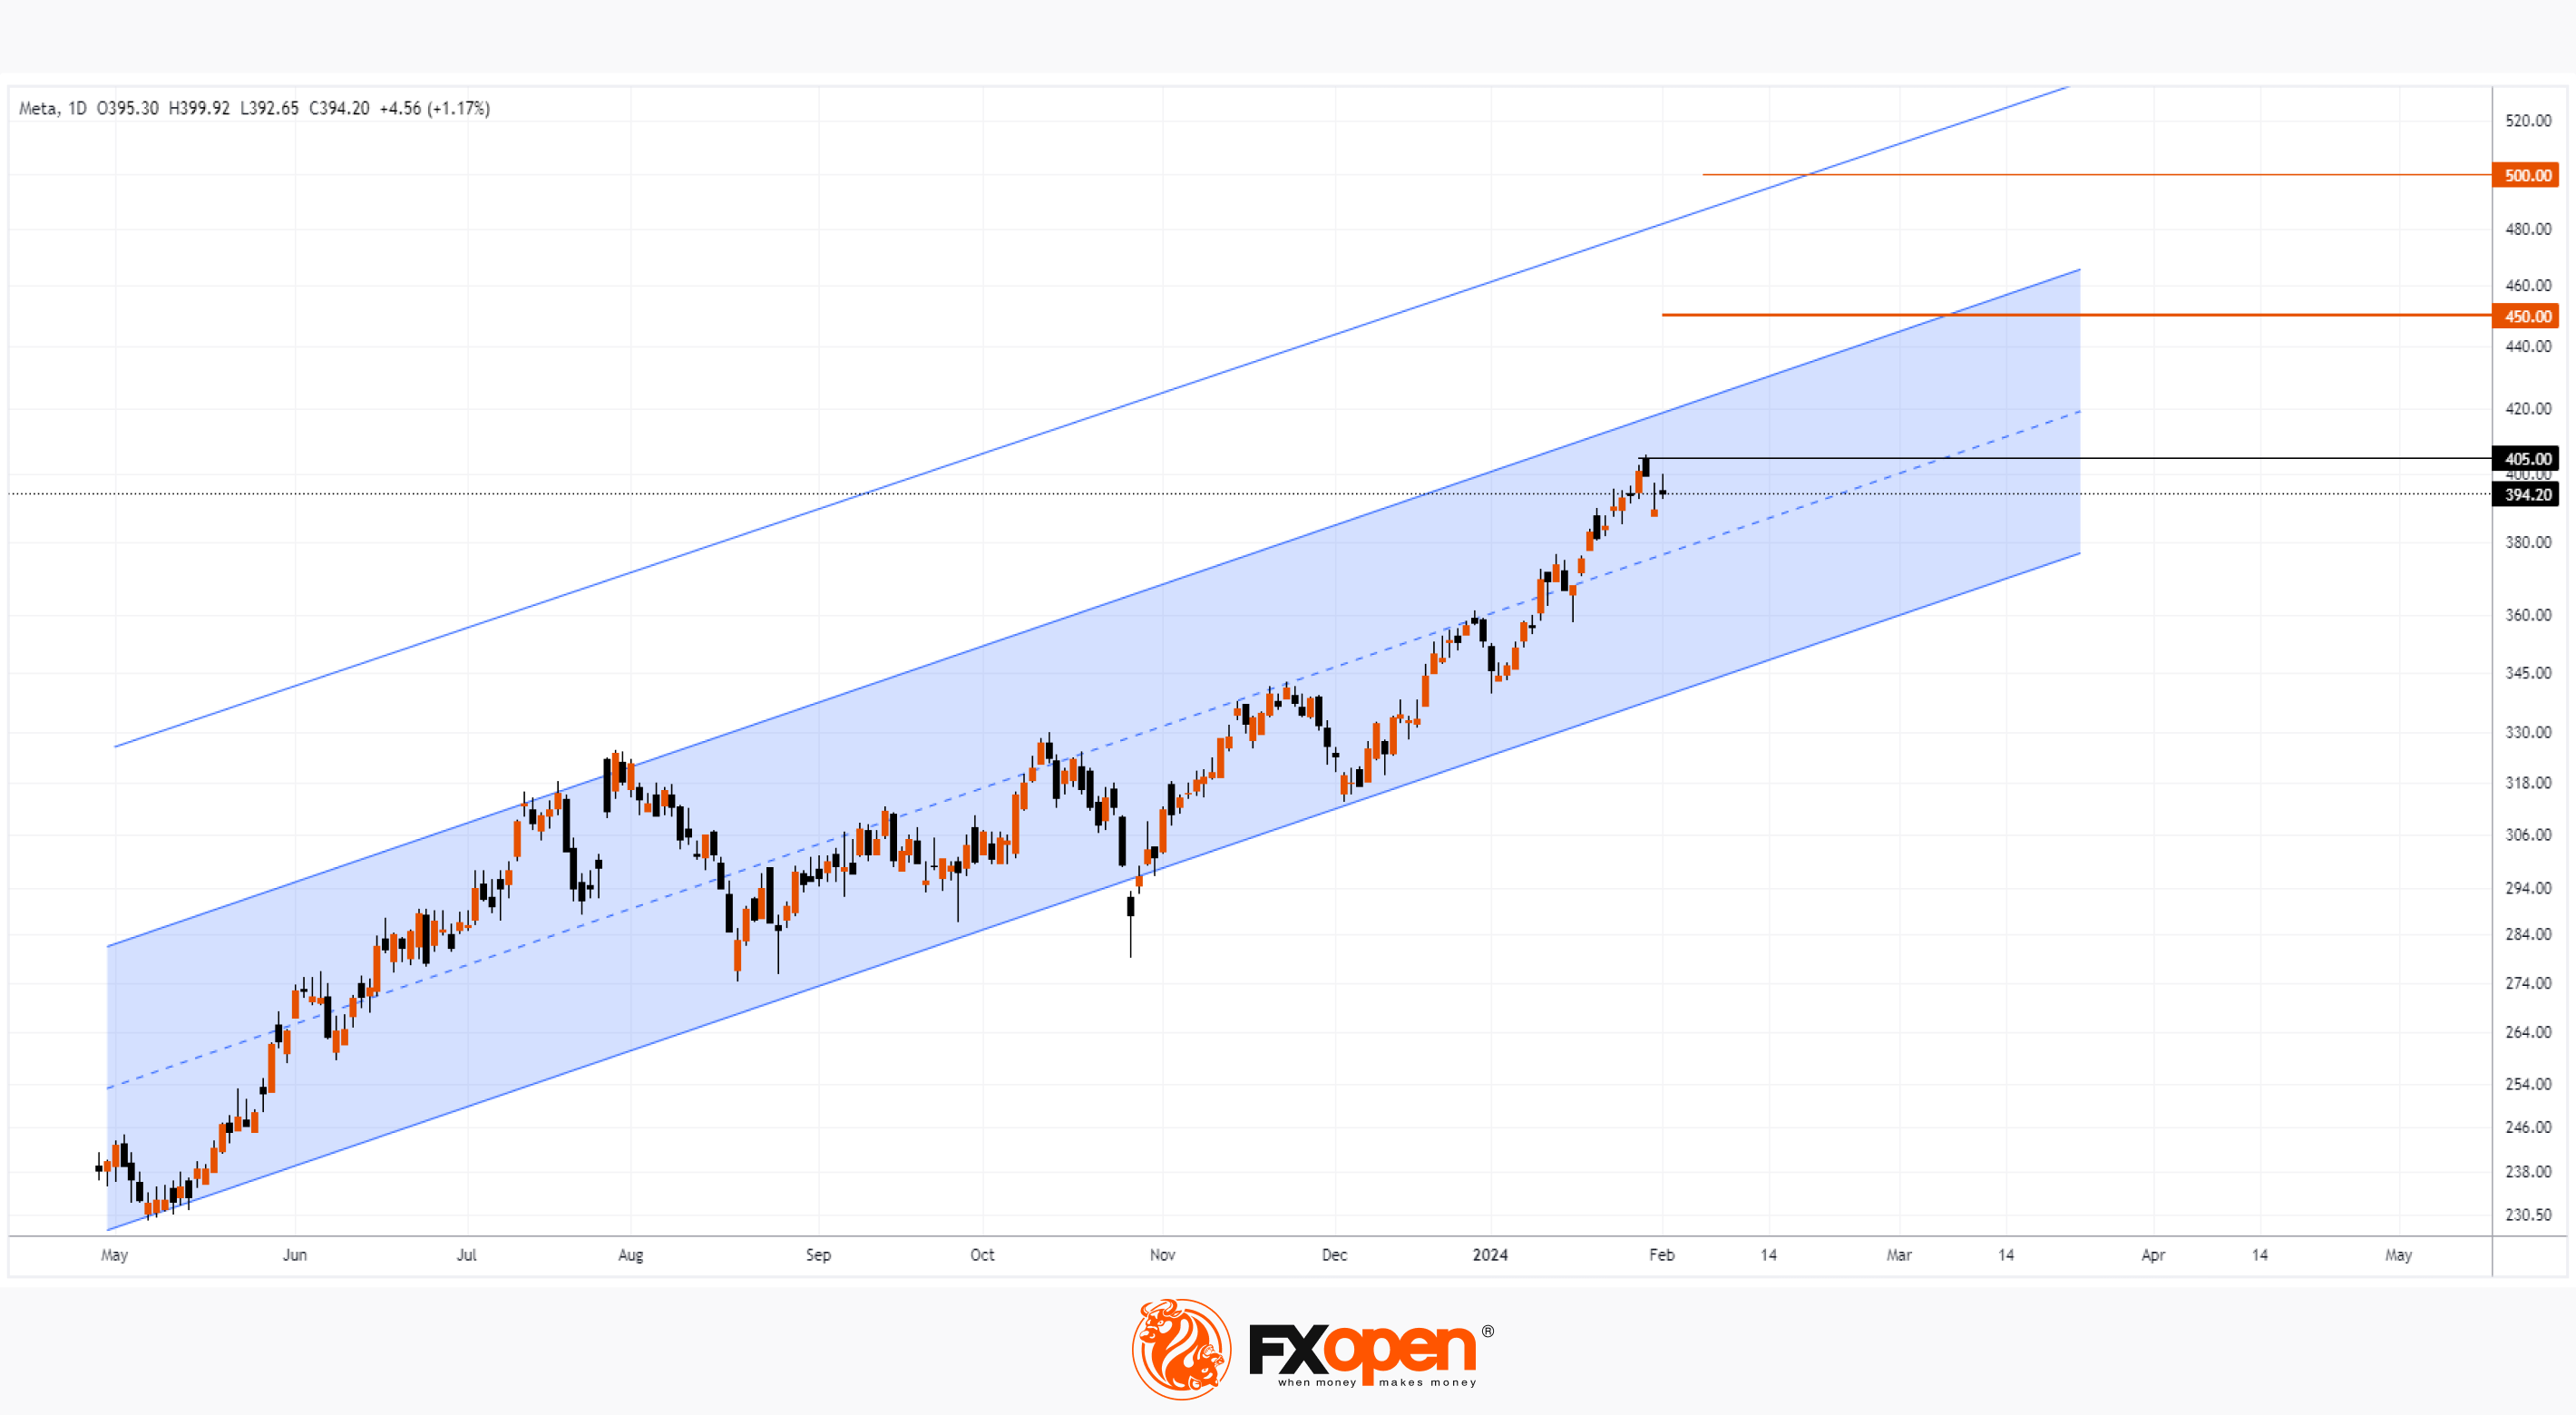
The META stock chart today shows that the price has broken out of the ascending channel within which it has been since May last year.
If widespread optimism about the company's progress continues, META's stock price could maintain its bullish momentum and rise closer to the blue line (drawn on the chart as a parallel channel) and the psychological USD 500 mark.
On the other hand, indicators will show that the market is overbought and some investors will probably take advantage of the temptation to take profits after the price soars - this will create the preconditions for the formation of a pullback.
The wide bullish gap that is likely to form at the opening of today's session could serve as an area of support for the META share price in the future - note that the price has not yet fallen into the May 2023 gap area.
In any case, fundamentally, META looks strong and could be considered a candidate for a long-term investment portfolio (if you don't already have it there).
Buy and sell stocks of the world's biggest publicly-listed companies with CFDs on FXOpen’s trading platform. Open your FXOpen account now or learn more about trading share CFDs with FXOpen.
This article represents the opinion of the Companies operating under the FXOpen brand only. It is not to be construed as an offer, solicitation, or recommendation with respect to products and services provided by the Companies operating under the FXOpen brand, nor is it to be considered financial advice.
Stay ahead of the market!
Subscribe now to our mailing list and receive the latest market news and insights delivered directly to your inbox.


Latest articles
EUR/CHF: Which Central Bank Is Backing Its Currency Harder?
The EUR/CHF pair is trading within a clear divergence between the two central banks. The ECB raised rates by 25 basis points on 11 June, lifting the deposit rate to 2.40% — its first hike since 2023 — after eurozone

USD/JPY Tests Multi-Year Highs, While USD/CAD Holds Near Yearly Peaks
After a strong rally in the US dollar at the end of last week, the currency has moved into a consolidation phase against major counterparts. Investors remain cautious ahead of the release of the ADP employment report for the US
EUR/GBP: BoE Caution Versus ECB Determination
Against the backdrop of a weak UK economy and inflation above target, the Bank of England paused on 18 June, leaving the base rate unchanged at 3.75% for a fourth consecutive meeting, despite internal disagreements among committee members over