


Microsoft (MSFT) Shares Drop Over 3% This Month
FXOpen
An overview of stock market charts since the beginning of the month reveals that while the Nasdaq 100 index (US Tech 100 mini on FXOpen) is in positive territory, Microsoft (MSFT) shares have underperformed significantly. The opening price on 1st October was $427.47, but by yesterday's close, it had fallen over 3%.
One of the key drivers behind this bearish sentiment is analysis from Oppenheimer, suggesting that Microsoft's financial performance may be negatively impacted by losses related to OpenAI. Additionally, Oppenheimer downgraded Microsoft's stock rating, a concerning sign ahead of the upcoming third-quarter earnings season.
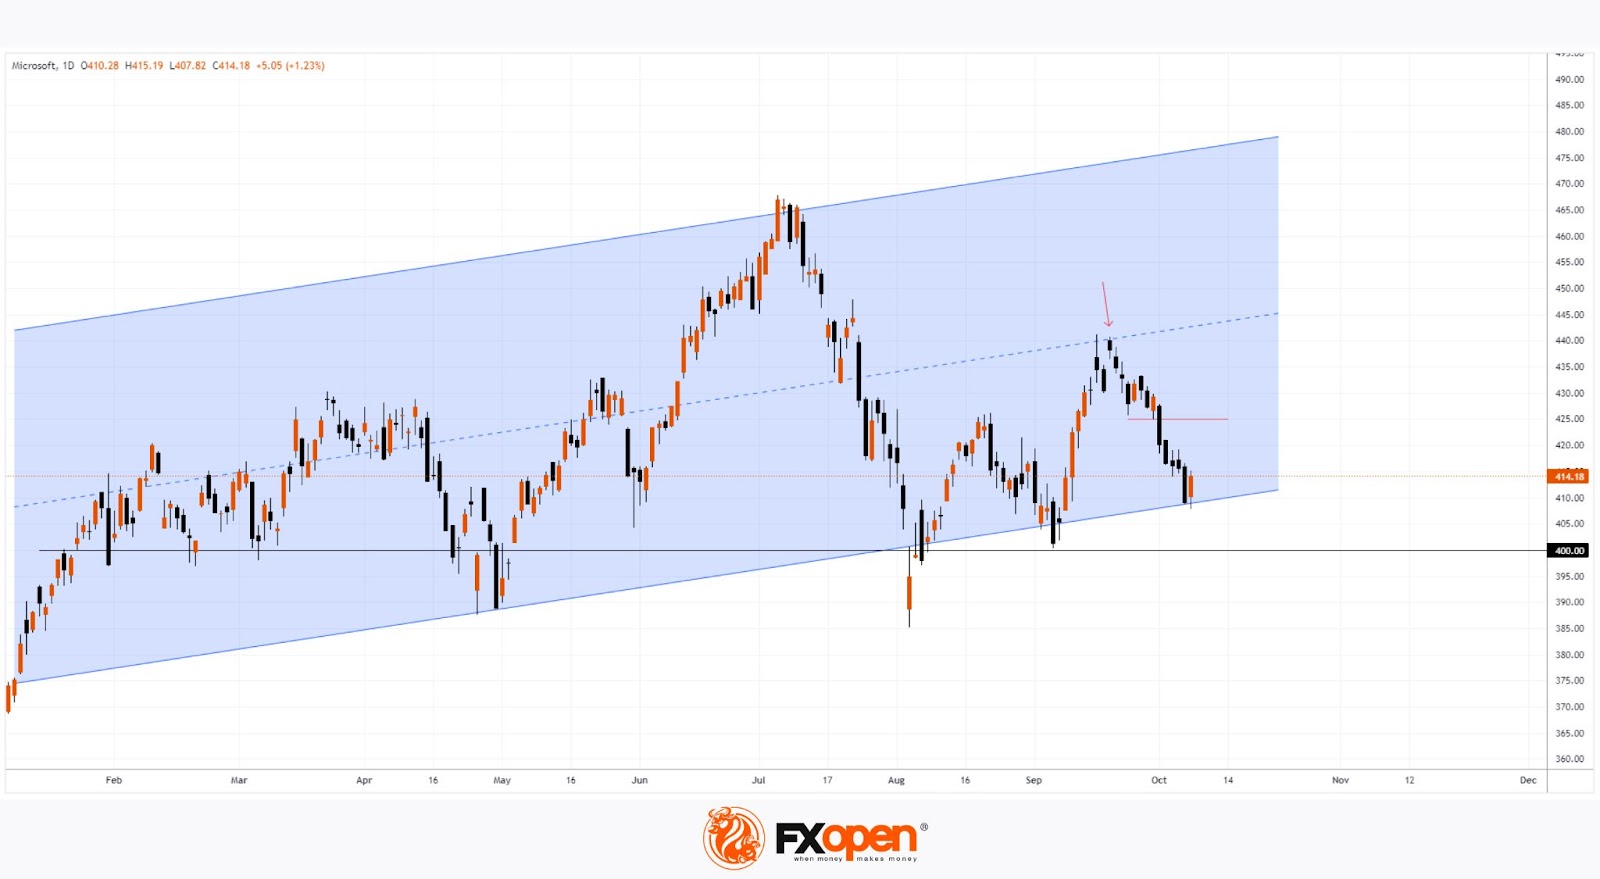
Technical analysis of Microsoft's (MSFT) stock chart shows that the price is hovering around a critical support zone, which is formed by:
→ the lower boundary of an upward channel that has been in place since early 2024 (marked in blue);
→ the psychological level of $400 per share.
What could happen next?
Bullish outlook: Microsoft's (MSFT) share price may reverse upwards from this support zone. Yesterday’s bullish candle indicates a potential increase in demand.
Bearish outlook: The median line of the blue channel has acted as resistance (shown by the arrow). It’s possible that the next level where bears could confirm control is the former support at $425.
Which scenario plays out largely depends on Microsoft's upcoming earnings report, scheduled for 22nd October.
Buy and sell stocks of the world's biggest publicly-listed companies with CFDs on FXOpen’s trading platform. Open your FXOpen account now or learn more about trading share CFDs with FXOpen.
This article represents the opinion of the Companies operating under the FXOpen brand only. It is not to be construed as an offer, solicitation, or recommendation with respect to products and services provided by the Companies operating under the FXOpen brand, nor is it to be considered financial advice.
Stay ahead of the market!
Subscribe now to our mailing list and receive the latest market news and insights delivered directly to your inbox.


Latest articles


Market Repricing of Risk as Gold Loses Safe-Haven Demand
Geopolitical tensions in the Middle East had remained the primary macro driver for the gold market over recent weeks; however, on 8 April the situation shifted sharply as the United States and Iran agreed to a temporary two-week ceasefire, including

Commodity Currencies on the Rise: Market Focus Shifts to US and Canadian Data
Commodity-linked currencies continue to strengthen, while the US dollar remains under pressure amid easing geopolitical tensions and a shift in investor preference towards riskier assets. Reports of a temporary ceasefire between the US and Iran have helped stabilise sentiment and