


Microsoft (MSFT) Shares Drop Over 6% After Earnings Report
FXOpen

According to the Microsoft (MSFT) stock chart:
→ The candle on 29 January closed around $441 before the company released its Q4 2024 earnings report.
→ As a result, the 30 January session opened with a significant bearish gap and closed lower at around $415, marking a total decline of over 6%, despite the company exceeding analysts' expectations.
Media reports indicate:
→ Earnings per share (EPS) stood at $3.23, surpassing the forecast of $3.11.
→ Total revenue reached $69.63 billion, beating the projected $68.78 billion.
However, investor concerns arose due to slowing growth in Microsoft's Azure cloud segment and rising AI development costs. Business Insider reports that Microsoft plans to spend $80 billion on AI infrastructure this financial year. While this substantial investment aims to strengthen its AI position, doubts remain about its long-term profitability.
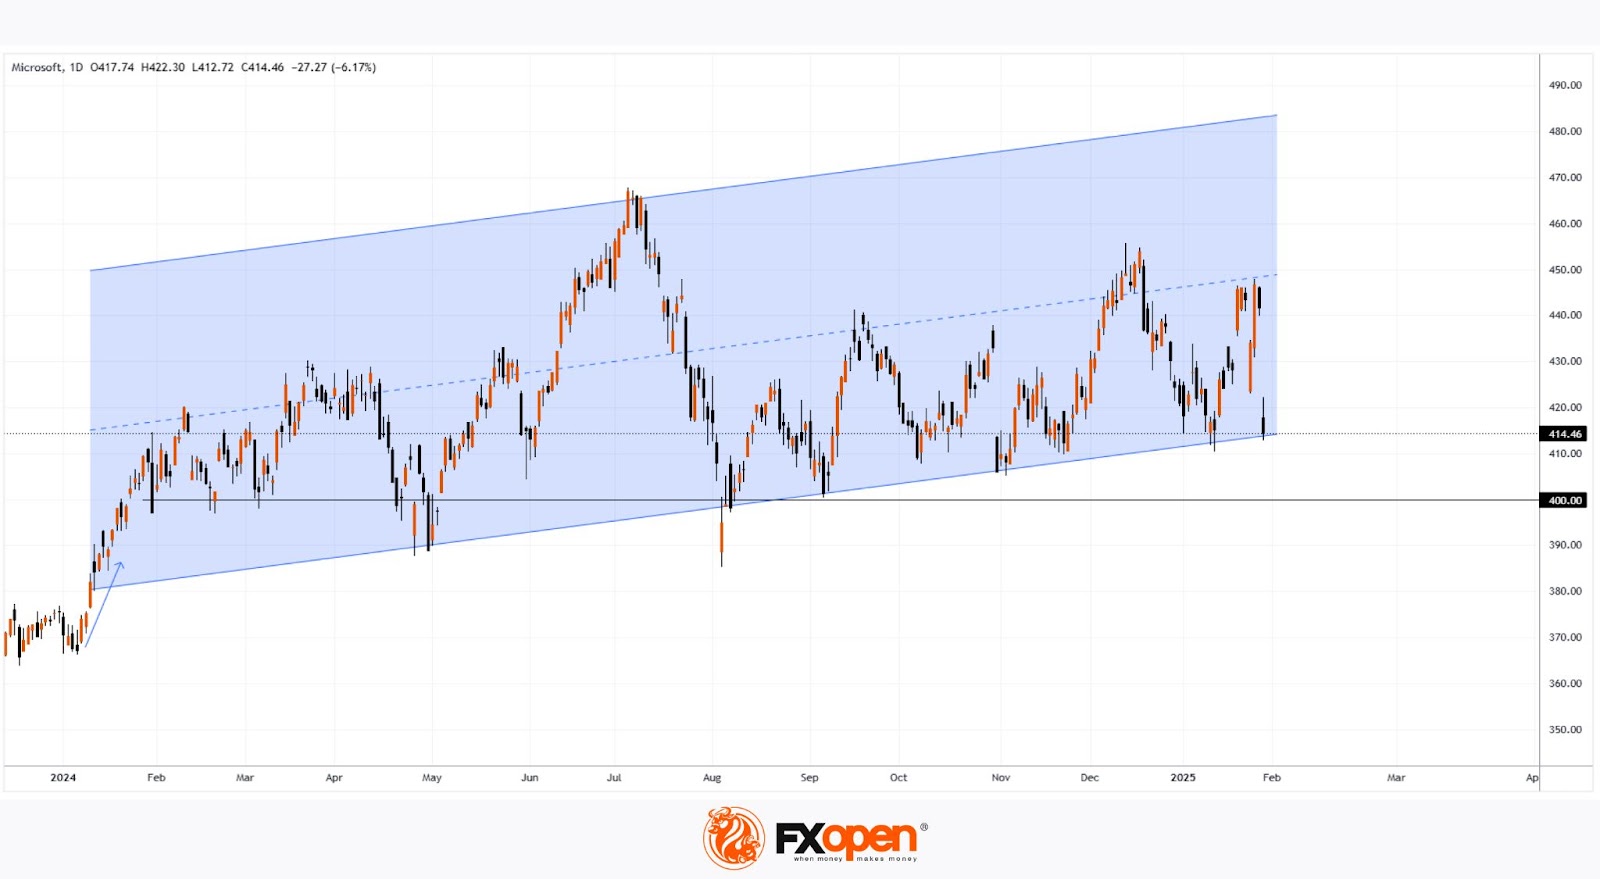
The technical analysis of the Microsoft (MSFT) stock chart presents a concerning picture, as the price has dropped to a key support level—the lower boundary of the upward channel (shown in blue). This channel was formed by a strong bullish impulse in early 2024 (indicated by an arrow), driven by AI enthusiasm. However, sentiment has shifted, with AI now acting as a selling trigger, increasing the risk of MSFT breaking below this key support.
If this happens, MSFT may test the psychological level of $400 per share once again. Notably, in 2024, the price has not stayed below this level for long.
Despite the recent decline, analysts remain optimistic about MSFT stock. According to a TipRanks survey:
→ 27 out of 30 analysts recommend buying MSFT.
→ The average 12-month price target for MSFT is $508.
Buy and sell stocks of the world's biggest publicly-listed companies with CFDs on FXOpen’s trading platform. Open your FXOpen account now or learn more about trading share CFDs with FXOpen.
This article represents the opinion of the Companies operating under the FXOpen brand only. It is not to be construed as an offer, solicitation, or recommendation with respect to products and services provided by the Companies operating under the FXOpen brand, nor is it to be considered financial advice.
Stay ahead of the market!
Subscribe now to our mailing list and receive the latest market news and insights delivered directly to your inbox.


Latest articles

Natural Gas: key support amid renewed escalation
A key development on 13 April was the start of a naval blockade of Iranian ports, a direct consequence of the collapse of negotiations in Islamabad on 12 April. The blockade covers all vessels entering and leaving Iranian ports in

European Currencies Advance Amid Shifting Geopolitical Outlook
The initial rise in EUR/USD and GBP/USD was driven by reports of a temporary ceasefire between the United States and Iran, which reduced demand for the US dollar as a safe-haven asset. However, over the weekend, reports emerged

Market Analysis: GBP/USD Holds Firm, USD/CAD Bulls Target Breakout Move
GBP/USD started a downside correction from 1.3480. USD/CAD is gaining bullish momentum and might clear 1.3880 for more upside.
Important Takeaways for GBP/USD and USD/CAD Analysis Today
· The British Pound rallied toward 1.3500